Ogma 6.1 is here, bringing a major step forward in the graph visualization experience. From more expressive edges and smoother interactions to greater customization and faster development, this release helps developers build richer, more polished graph applications.
New edge badges, extremity text, and gradient edges make connections more meaningful at a glance. A grid background, refined grouping animations, enhanced Geo mode with deck.gl and Mapbox support, and improved performance with hundreds of layers bring greater flexibility and fluidity to your visualizations. Meanwhile, a new Jupyter widget, MongoDB tutorial, and redesigned examples page make it easier to get started and bring your ideas to life.
Latest version: 6.1.0
Edges do more than connect nodes. Connections are often where the story is in a graph. Ogma 6.1 gives you three new ways to make them speak for themselves.
Edges can now carry text labels at both ends, right next to the arrowheads. It's a natural fit for cybersecurity, network mapping and software architecture, where each end of a connection often means something different. You get more metadata on the graph, and the text stays sharp at any zoom level.
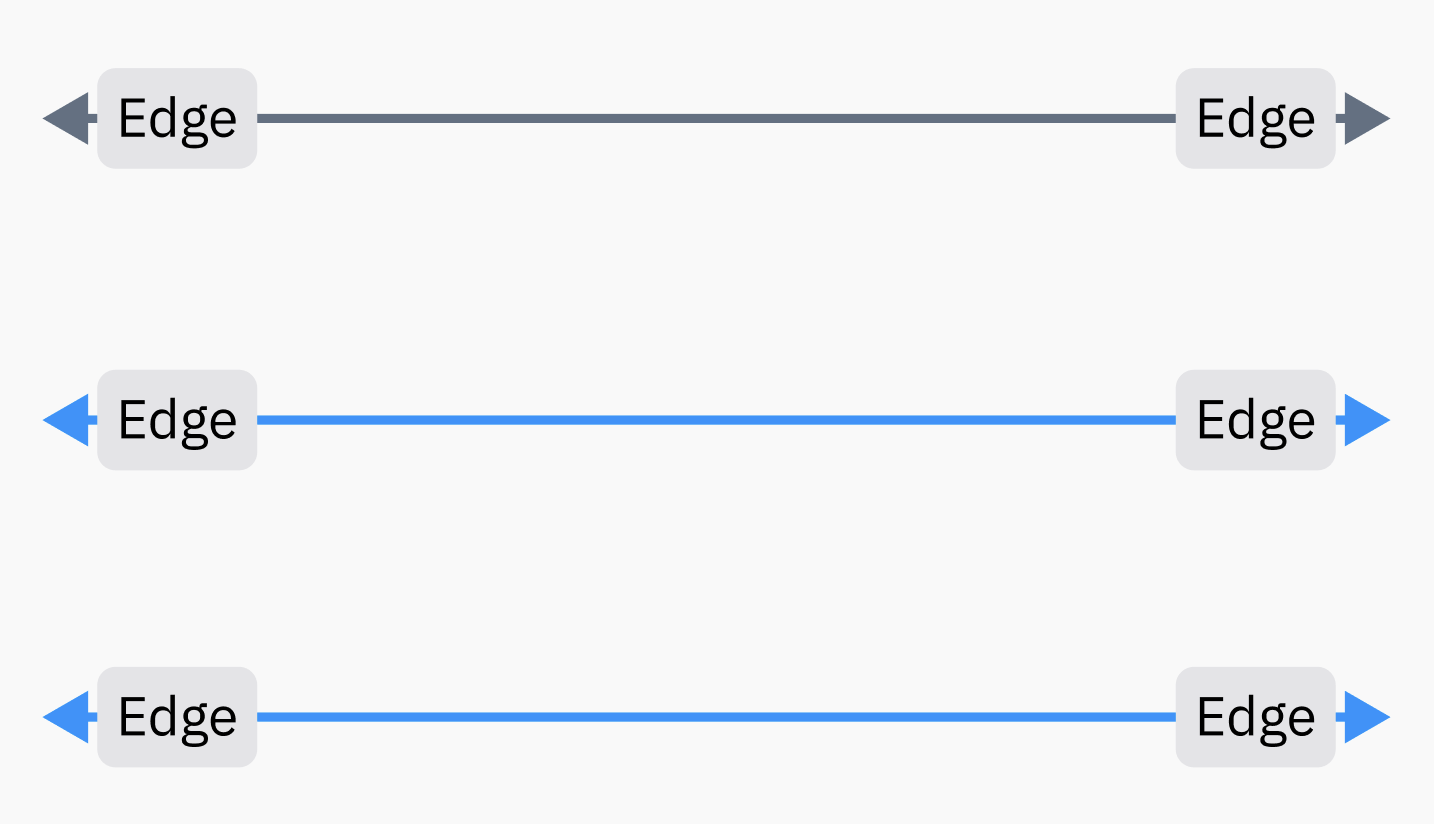
Native badges can now sit directly on edges, with text, colour and styling options. Viewers can tell what a connection is at a glance, without clicking on each edge. Icons can flag relationship types, such as a transfer or an alert. And when edges are grouped, a badge can show how many were bundled together, which is hard to judge by eye once lines overlap.
Badges also make dense graphs easier to read, with far less clutter than text labels. We're already prototyping pill-shaped badges that fit longer numbers and text.
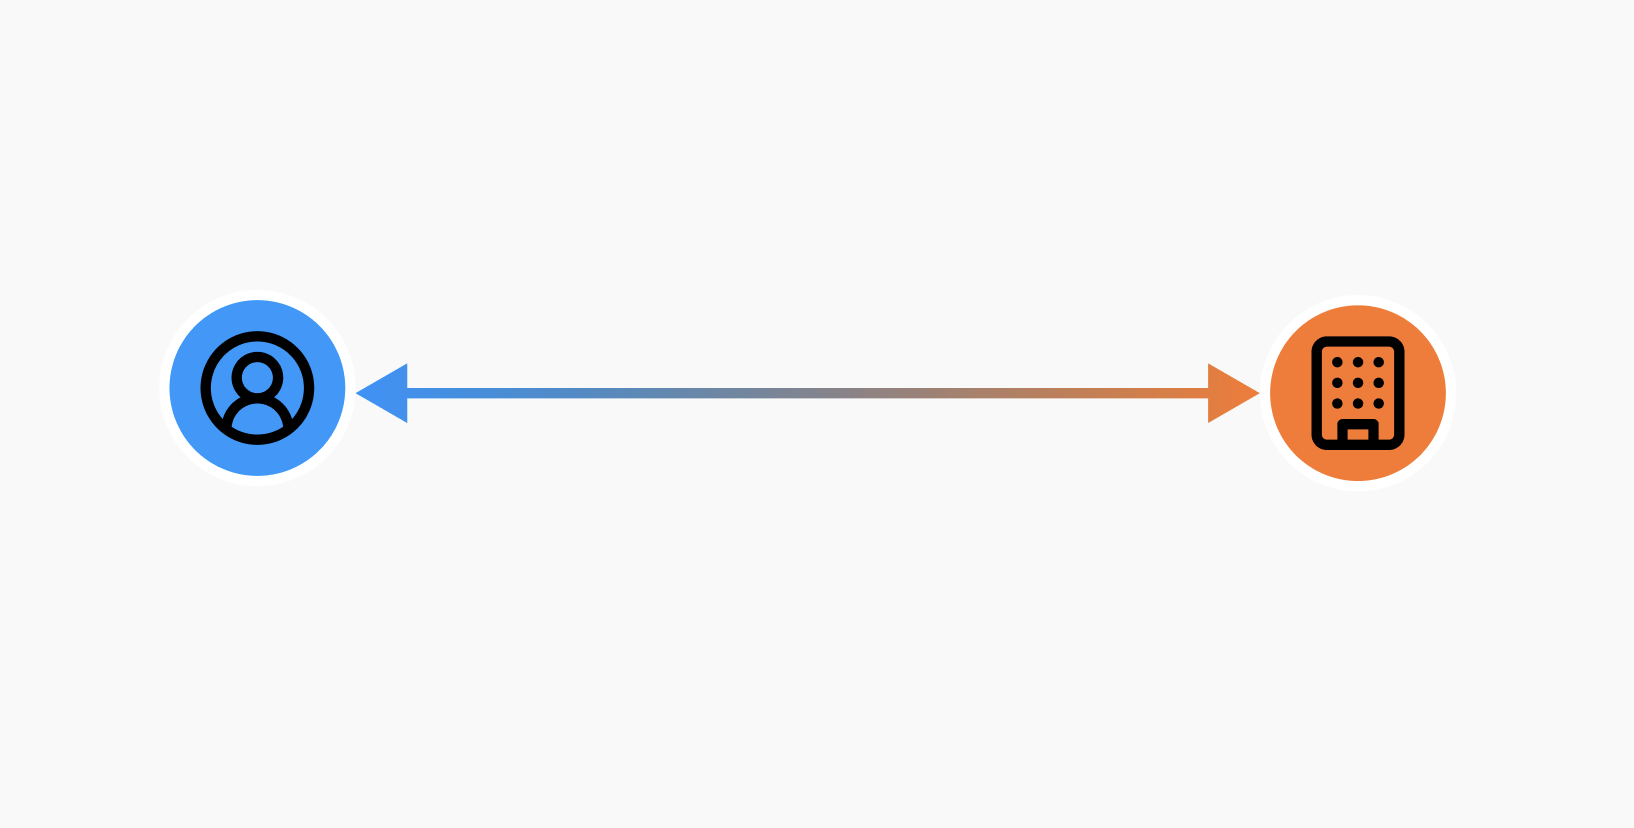
Edges can now blend smoothly from the colour of the source node to the colour of the target node. It shows direction and endpoint colour without needing arrowheads, and it helps dense graphs read more clearly.
A great graph visualization isn't just about how information is displayed, but also how easily users can navigate and interact with it. Ogma 6.1 brings several refinements to make graph layouts more reliable, interactions more fluid, and visualizations easier to customize.
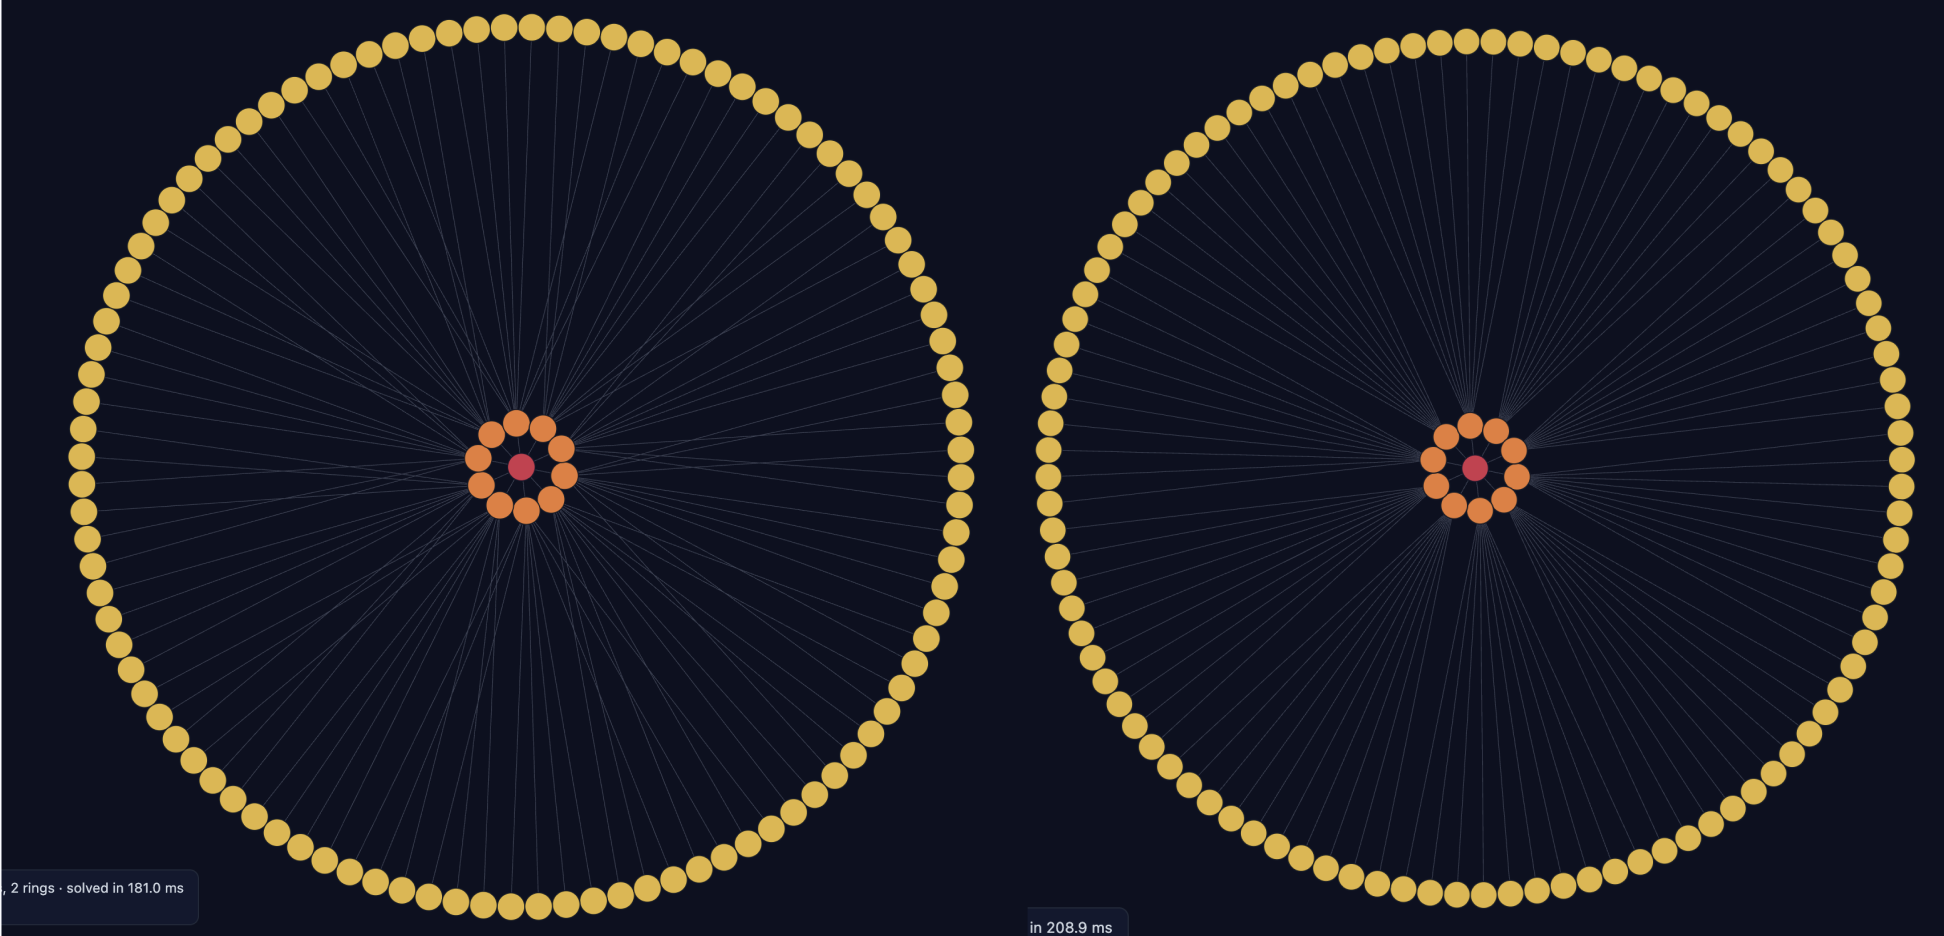
We've rebuilt the radial and concentric layouts on a standalone, separately maintained layout engine. The old radial layout could stop too early on small and star-shaped graphs, giving less efficient results. The new one is more reliable on those graphs, and tree layouts are cleaner, with fewer crossing edges so hierarchies are easier to read. Rings also keep a minimum gap, so they never overlap. Your existing settings keep working as before.
Expanding and collapsing groups now feels more fluid, with smoother animations that make changes to the graph easier to follow. It's a small but meaningful improvement, especially when exploring complex graphs with grouped data.
A new grid background gives your visualisation a sense of scale and makes manual rearrangement easier. Nodes can snap to the grid, so hand-arranged graphs look neat and presentable. If you've used a design or CAD tool, it will feel instantly familiar.
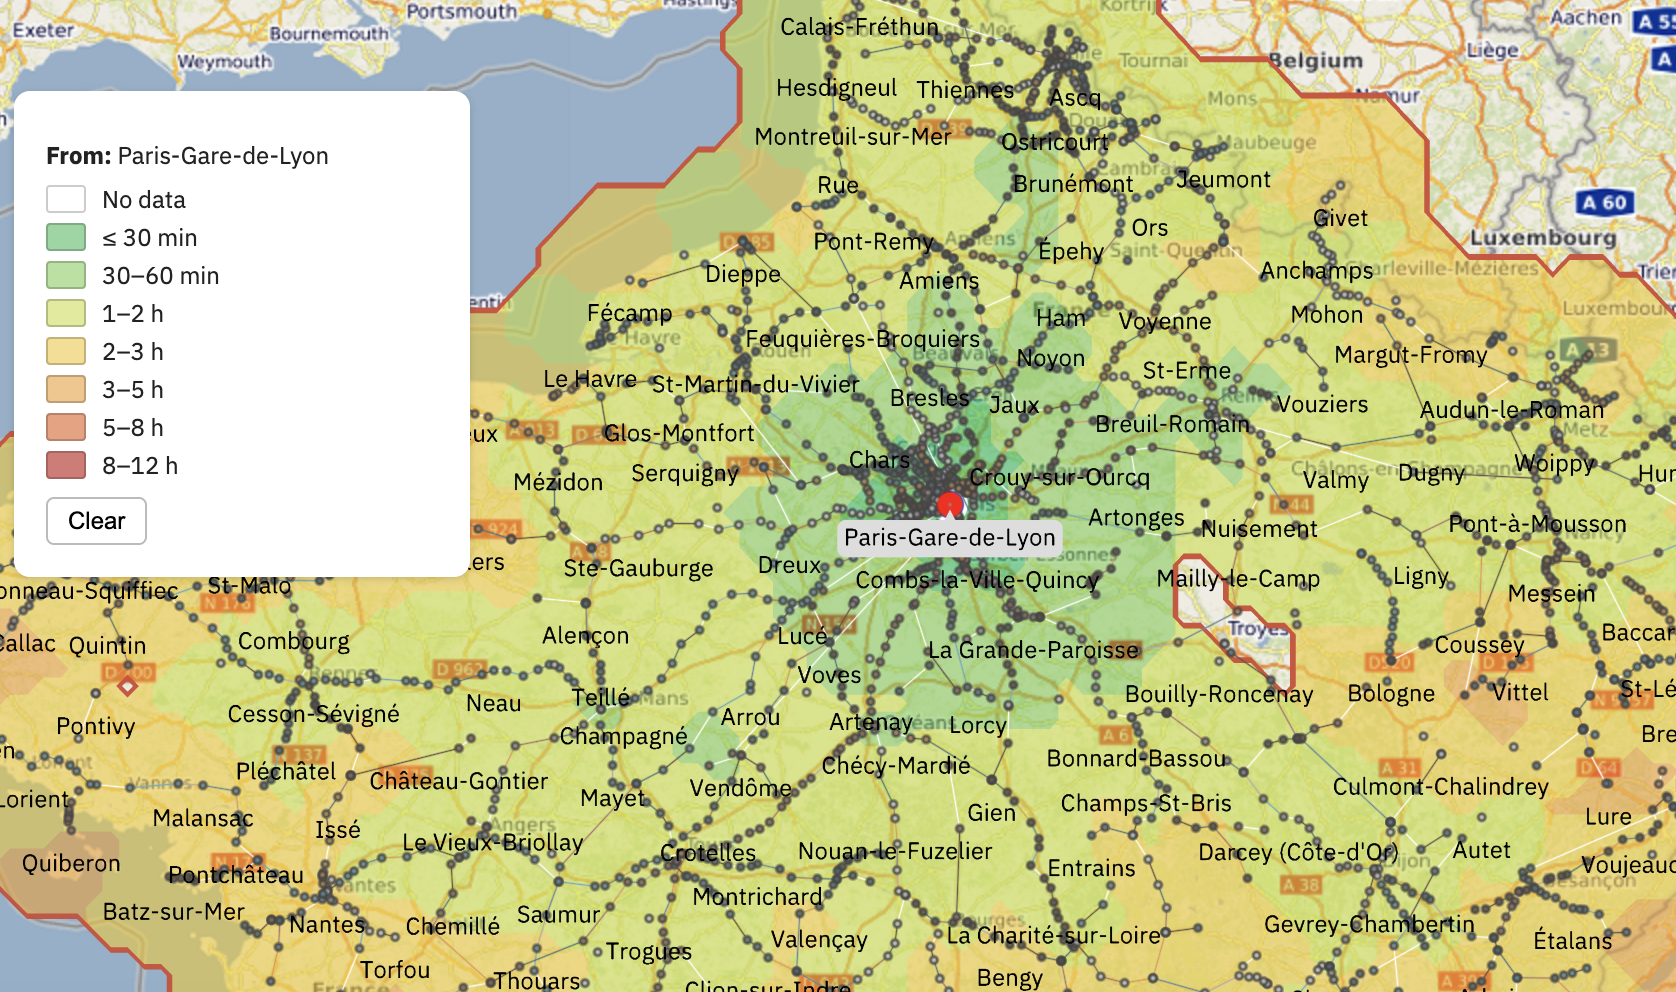
Deck.gl and Mapbox apps can now be integrated into Geo mode. Teams can reuse the map tooling they already have and build custom map experiences around their graphs. Combine graph visualization with existing mapping tools to create custom geospatial experiences, layer spatial data, custom map interactions and dynamically explore complex connections in their geographic context.
Ogma 6.1 adds a new approach to accessible keyboard navigation. Instead of jumping around the screen, you move through the graph by following its connections, from a node to its neighbours, using only the keyboard. It's designed with sighted users in mind, and the camera follows along, so you never lose your place.
It's faster for power users who prefer keyboard-driven investigation, and it helps meet the accessibility standards that enterprise and public-sector buyers ask for. It's also a great way to walk an audience through a graph during a demo.
Building on the annotations rewrite in Ogma 6.0, we've added more customization options and designed a toolbar for a more seamless experience. It's a big step for Ogma customers as it means annotations are easier to implement, with no need to build a custom interface to get started.
Overlays such as tooltips and notes are now managed together, so pages with hundreds of them stay smooth when panning and zooming. Layers are also no longer cut off at the edges of the screen when you zoom out. Existing overlays work as before, with an easy opt-out for special cases.
We've also improved how custom layers render including the new grid background. Layers remain visible when zooming out, no longer flicker when hovering over nodes, and sharpen more quickly after zooming.
These improvements help deliver a more responsive and visually consistent experience, particularly in graph applications with complex overlays and custom visual elements.
The sooner you see your first graph, the sooner you see what Ogma can do. Three updates in 6.1 are built to shorten that path
Run a single command, npm create @linkurious/ogma my-app, and Ogma sets up a ready-to-use project for your chosen build system. Dedicated wrappers cover React, Angular, Vue.js and Svelte. There's no manual setup, so evaluations and trials get to a working graph much sooner. The scaffolding script also installs an AI skill automatically, to help AI coding assistants work with Ogma. We've reworked and tested it, so the guidance is more reliable.
Building on the Ogma Design Kit introduced with 6.0, you can now export styling variables from Figma and generate a theme.ts file from them. Handover from designers to developers gets easier, turnaround between design, product and engineering teams gets faster, and styling stays more consistent. No more copying the same values into dozens of places.
Ogma 6.1 makes it easier for data scientists and technical teams to get started and build interactive graph visualizations.
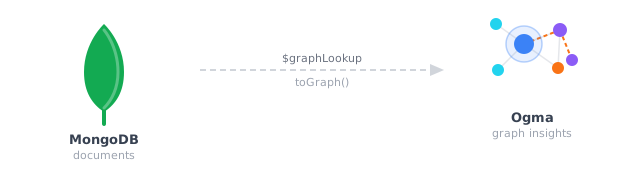
Most applications already store relationships in their data. A product belongs to a category. An order links a customer to a list of products. Those references are a graph waiting to be seen.
Our new tutorial shows how to turn MongoDB data into an interactive graph. It follows a product co-purchase example for an online shop, and reveals buying patterns like the products that bridge different categories. It needs only under 200 lines of server code. For teams already storing relationship data in MongoDB, such as e-commerce, recommendations and customer analytics, it's a much quicker route to a first graph.
Data scientists work in notebooks, so we've brought Ogma to them. The new Ogma widget for Jupyter lets analysts build an interactive graph in Python, complete with layouts, style rules and grouping. There's no export step to a separate tool, and findings can be shared as reproducible notebooks. It works in JupyterLab, VS Code, Colab and Databricks.
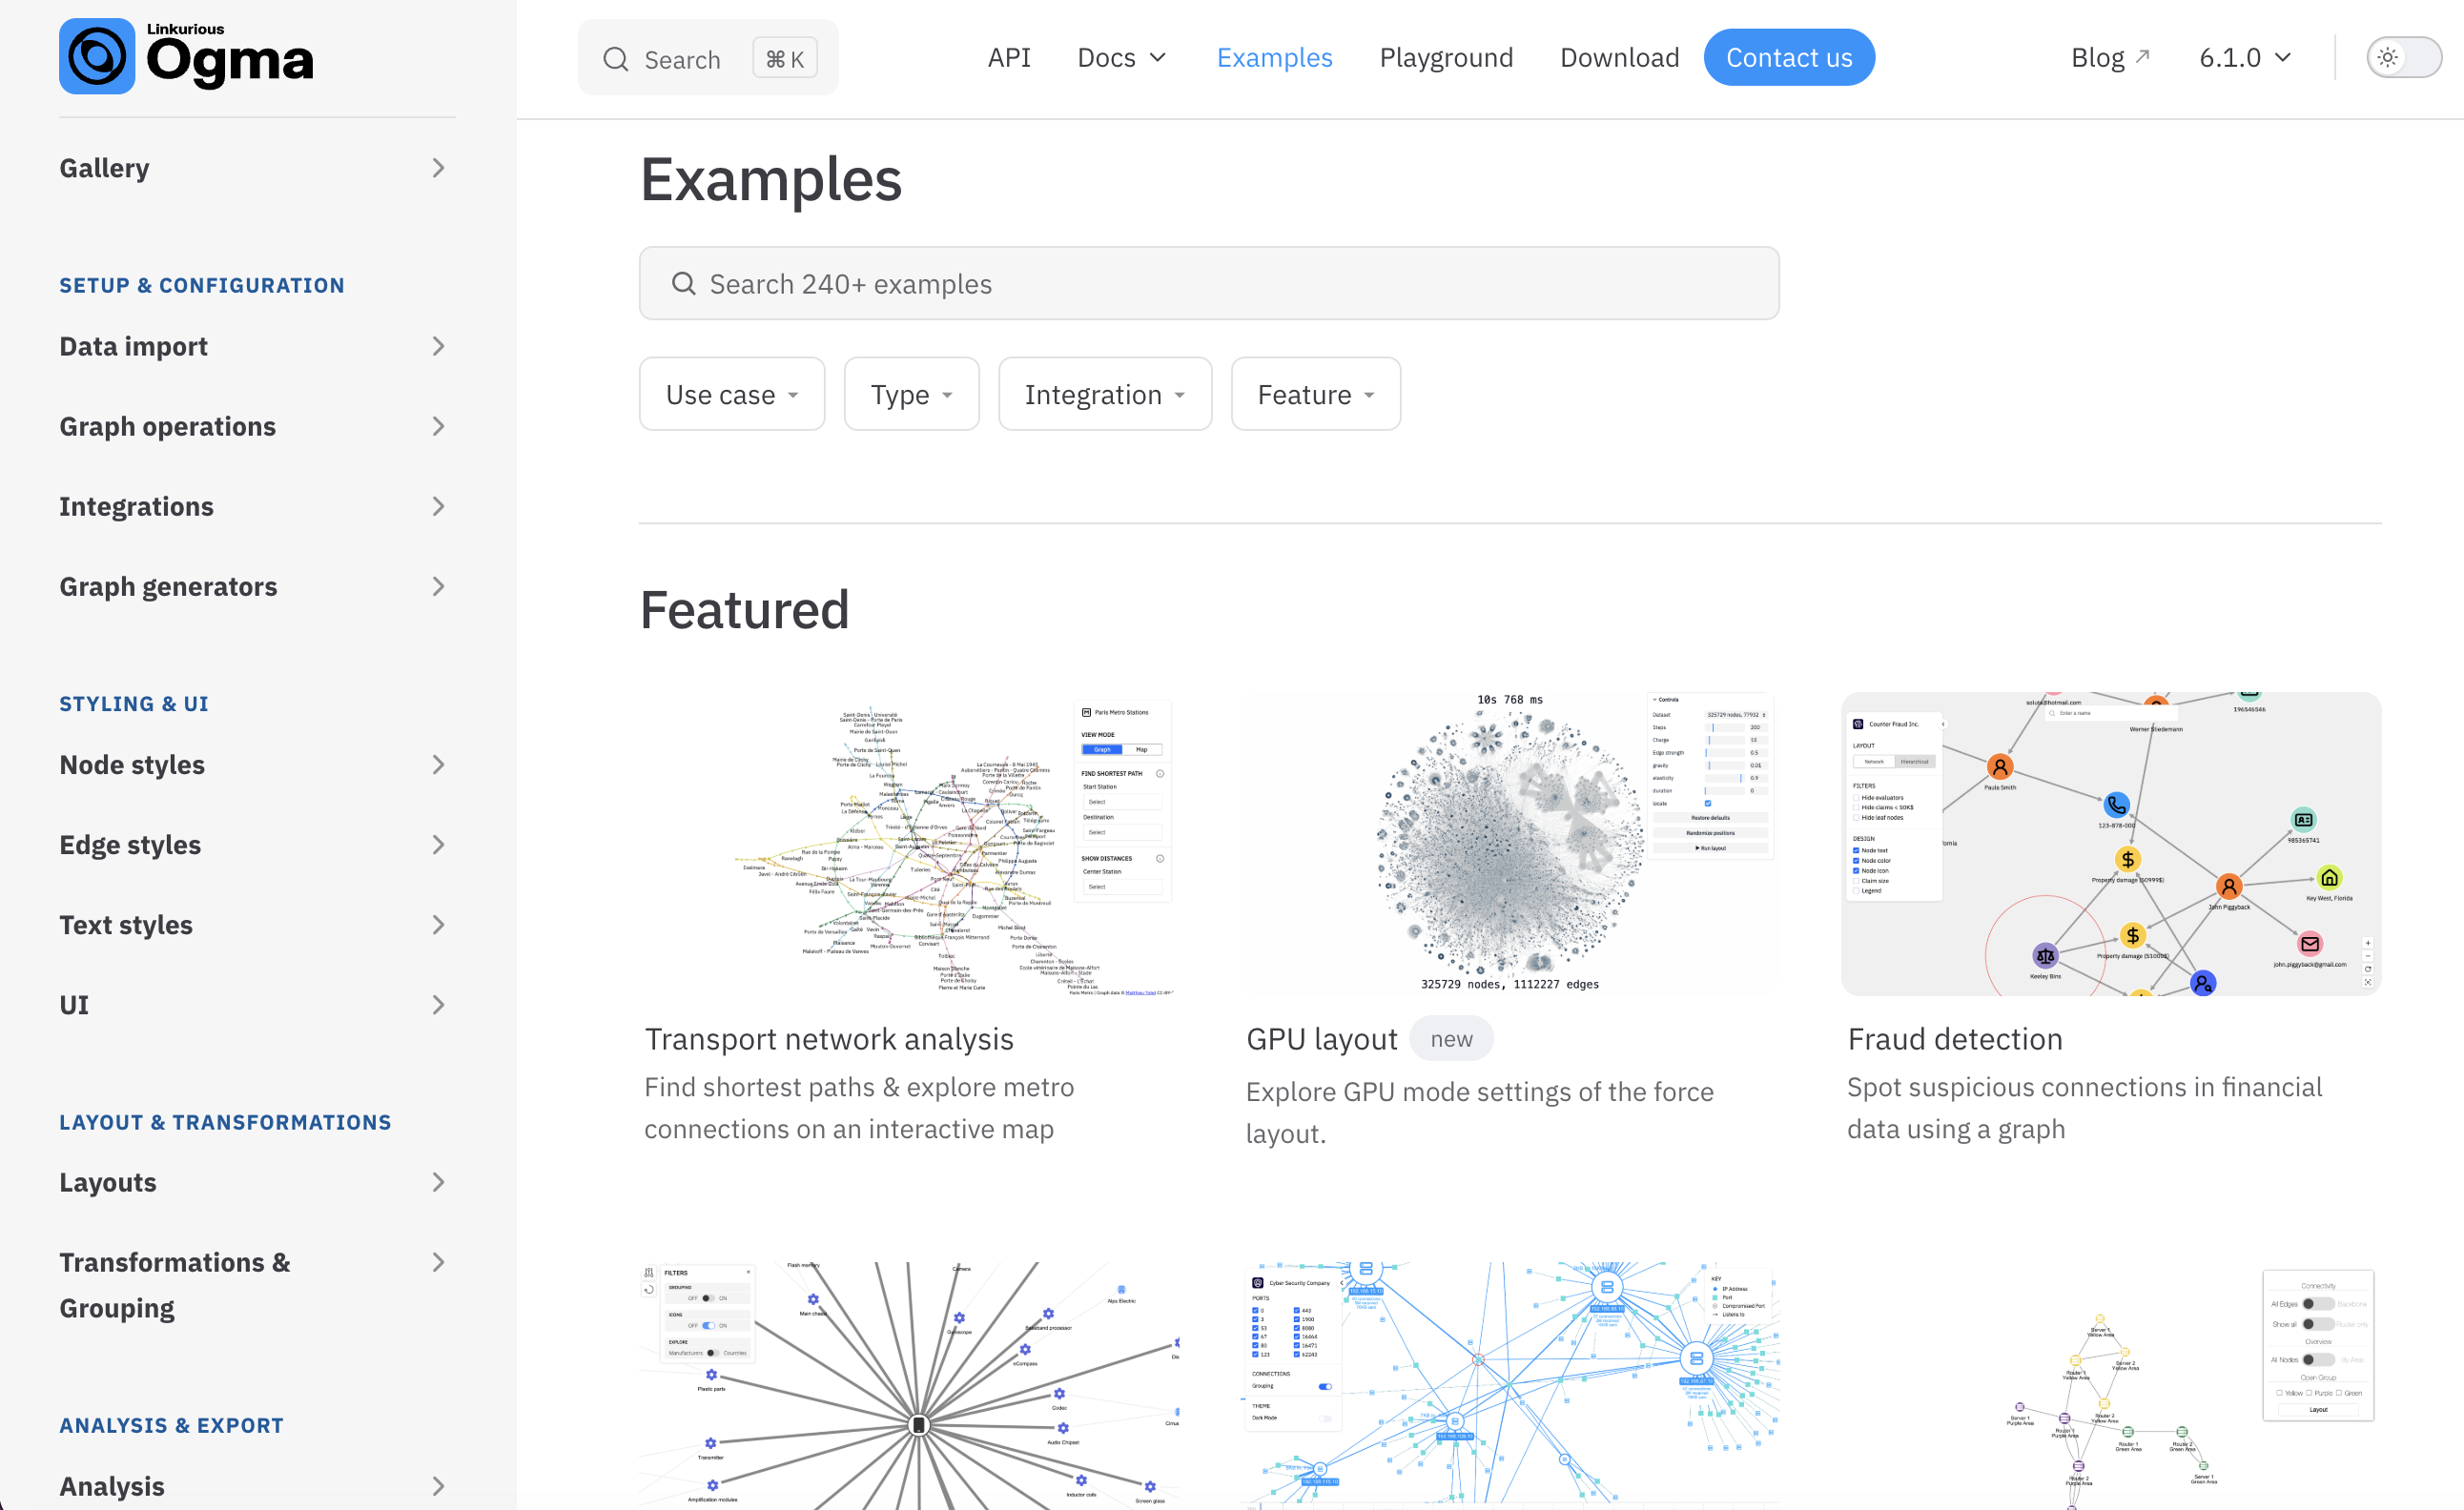
We know that examples pages are key to your exploration of Ogma, so we gave them a revamp. Examples are now grouped into categories, with a new search and filtering feature to find the right one faster. You can bookmark your favourites, and larger thumbnails with descriptions show what each example does before you click.
What does graph visualization look like in a real-world cybersecurity scenario? We've teamed up with Oracle to build an interactive demo using a dataset from Los Alamos National Laboratory, exploring how attackers compromised 104 accounts and 301 computers.
Discover how Ogma helps make complex connections and attack paths easier to investigate. Watch the Oracle's Analytics and Data TechCasts session.
Ready to try Ogma 6.1? Start with the new project creator, or browse the redesigned examples to find your next idea.
A spotlight on graph technology directly in your inbox.