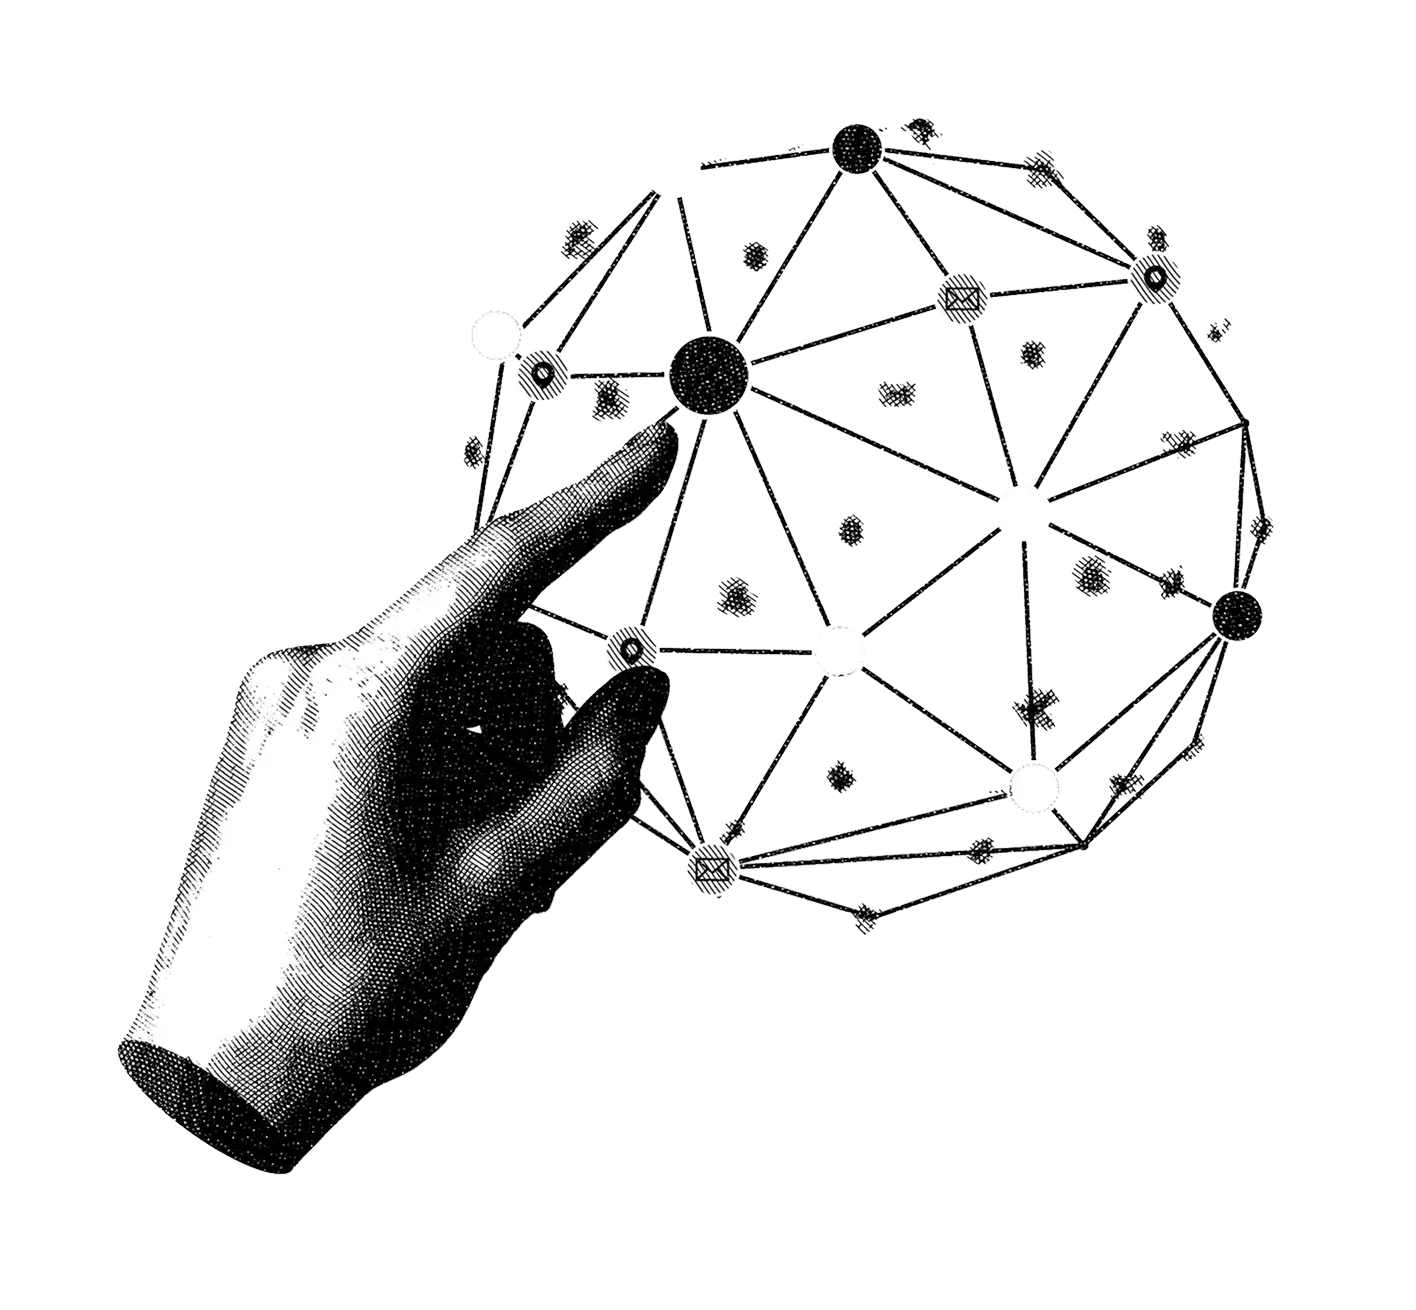
 Knowledge Graphs
From graph model to real-world insight
Knowledge graphs connect your disparate data sources, revealing patterns and relationships. With Linkurious' graph visualization and analytics solutions, you can explore those complex connections, surface business critical insights and make smarter decisions.
Modeling your data as graph is just the beginning
Organizations are drowning in data from multiple sources and systems, yet struggle to extract insights. Without the right tool to connect and contextualize information, relationships remain hidden and opportunities are missed.

Fragmented data across disconnected systems
Your data lives in databases, documents, emails, and many other formats. Without a way to bring structured and unstructured data together, teams lack a unified view and struggle to explore all relevant information in one place.

Graphs fail when they aren’t usable
A basic graph visualization tool can support early experimentation and validation. But without tools that make relationships easy to explore and understand, teams struggle to derive value from their knowledge graph, leaving it stuck at proof of concept.

One knowledge graph, many needs
A single knowledge graph often supports multiple teams and use cases. Without flexible and scalable graph tools, it becomes challenging to easily operationalize your graph across the enterprise and maximize the ROI for your organization.
When complex analysis depends on technical specialists
Exploring complex relationships and drawing conclusions often depends on technical skills. Many users lack intuitive tools to analyze knowledge graphs and understand what the connections actually mean.
Use cases
Linkurious adapts to your needs

Master data management

Data governance

Supply chain management

Biomedical research

Fraud detection

Cybersecurity


Benefits
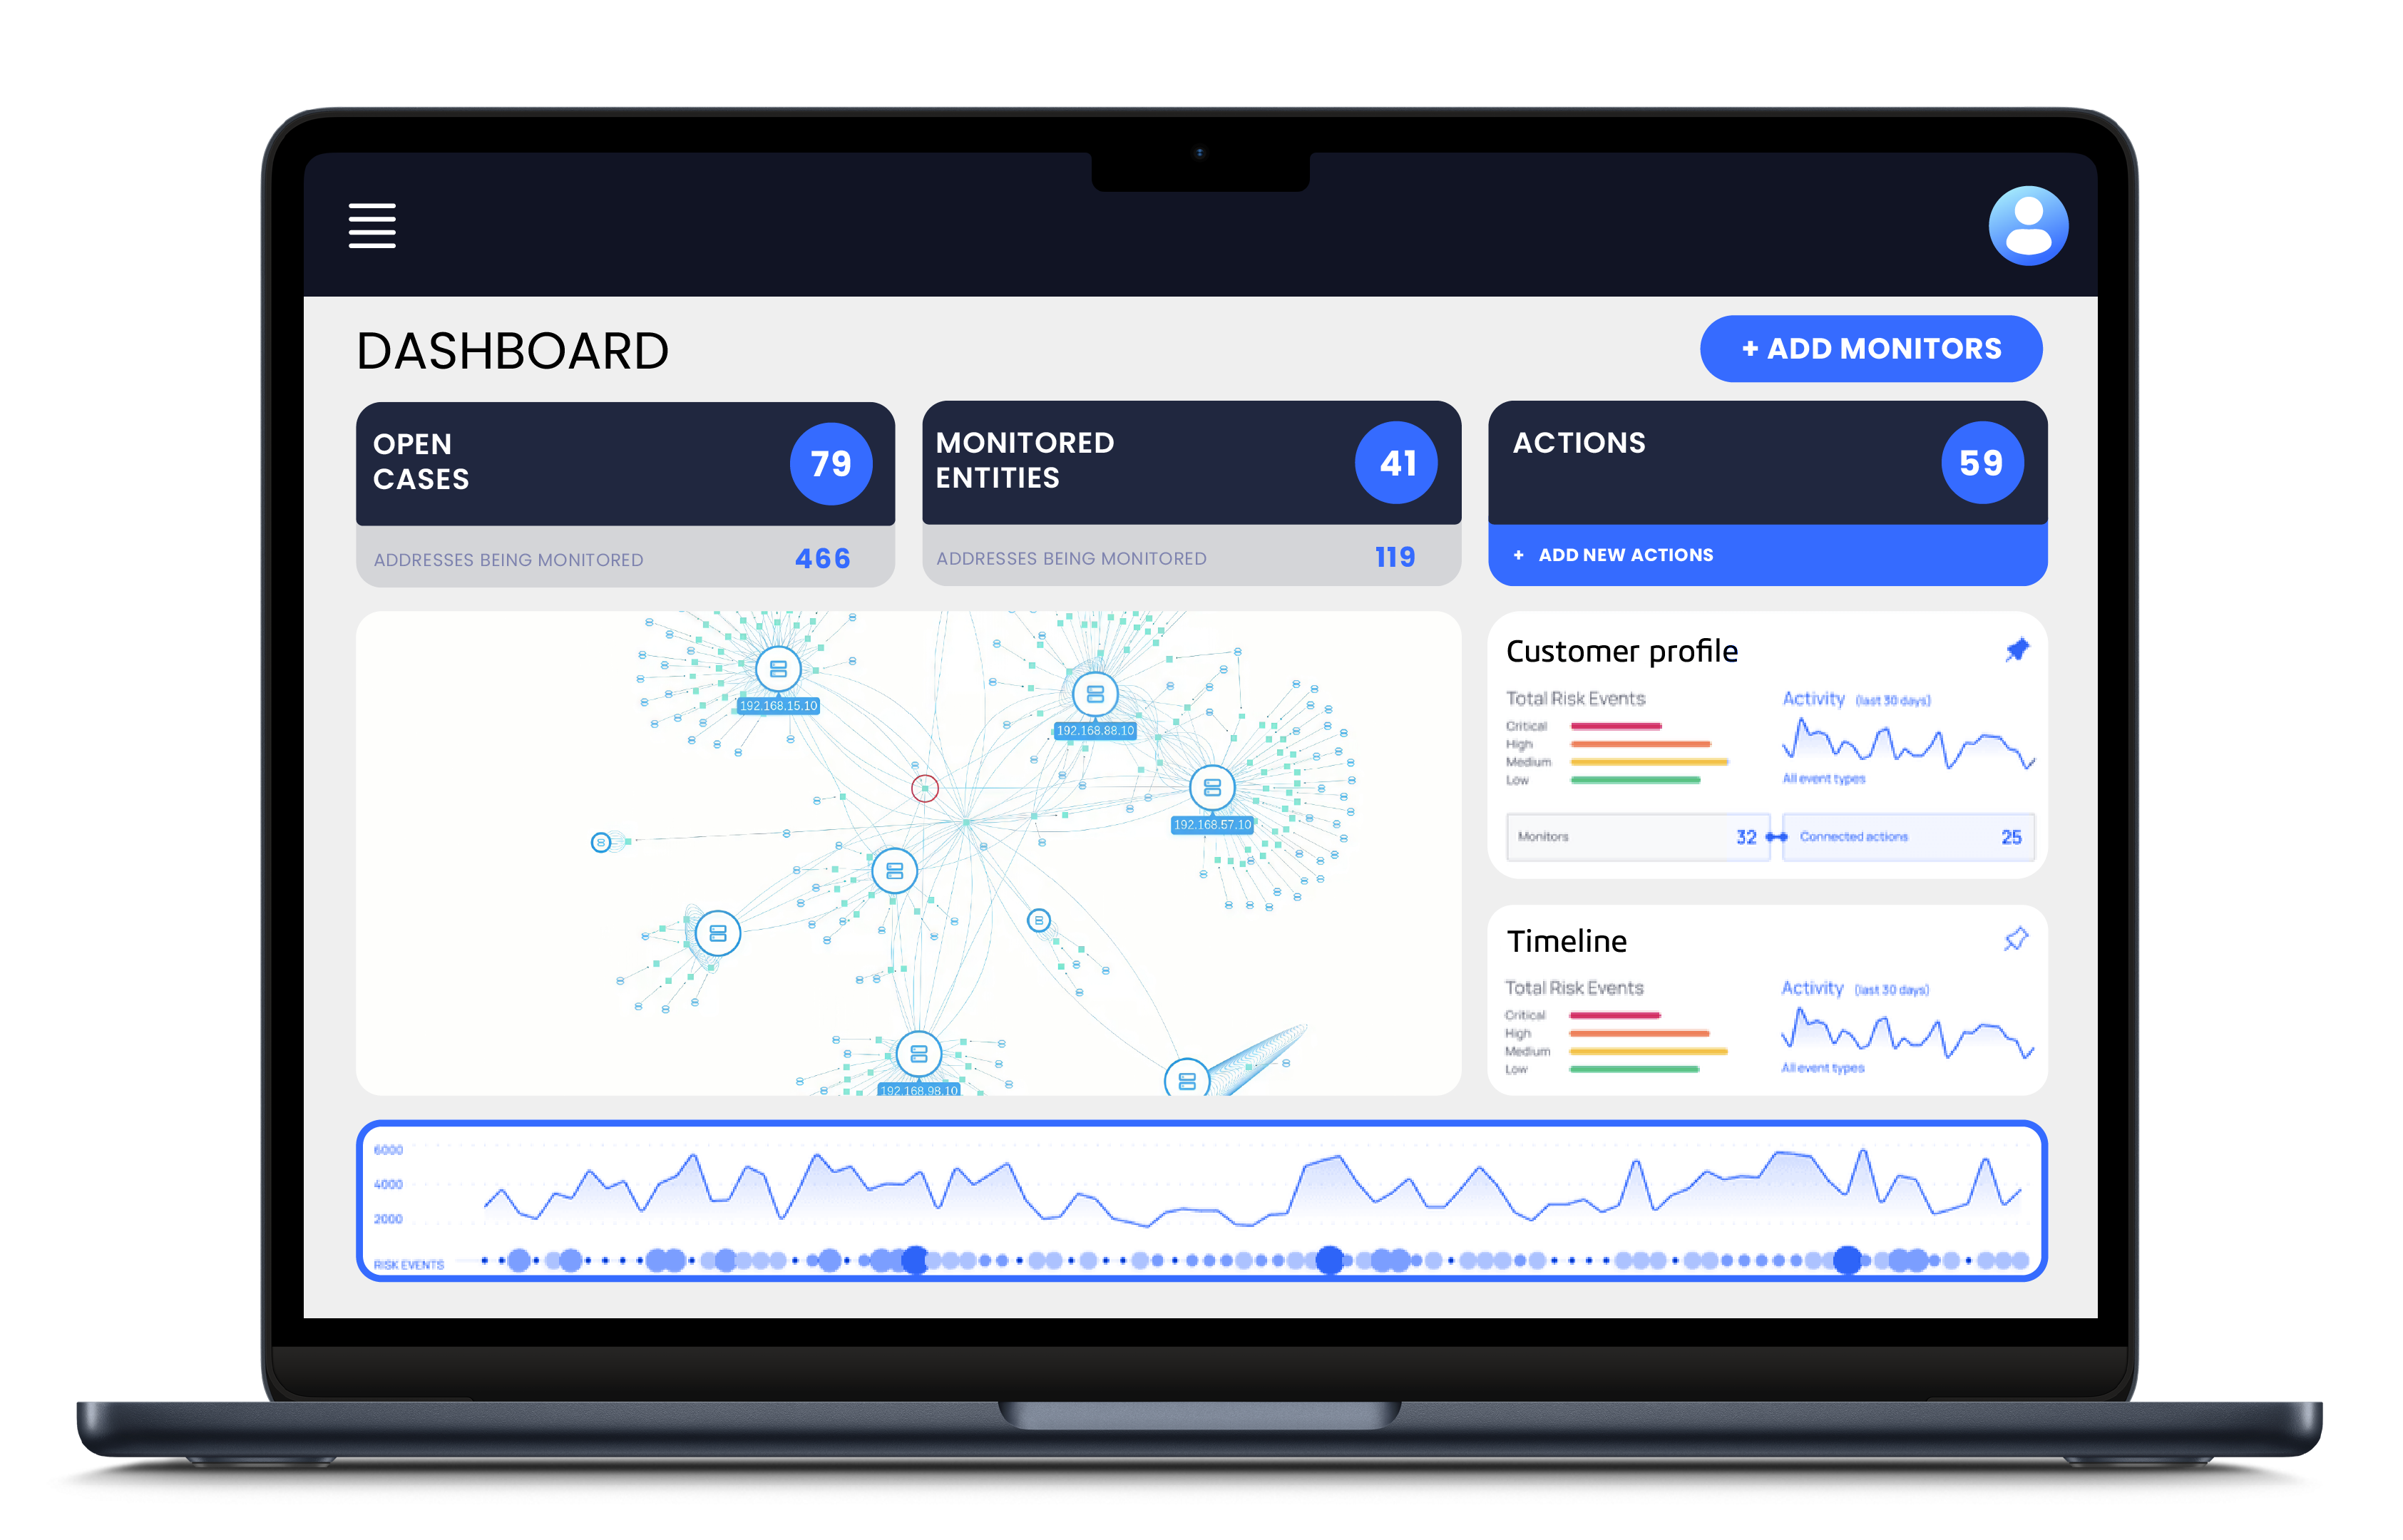
Make your knowledge graph usable, searchable, and impactful
Turn complex graph data into something teams can actually use. From intuitive exploration to advanced analytics, empower users across your organization to uncover insights, validate connections, and turn models into decisions.
A 360° view of your connected data
Bring together data from multiple sources into your knowledge graph. Teams gain a more complete view of their data and can explore it all in one place.
Complex connections, made simple
Intuitively search, filter, change layouts, follow paths, build advanced queries to explore connected data from multiple angles and better understand relationships and context within your knowledge graph.
Advanced analysis for every user
Visual exploration and no-code queries make it easier for all users to work with complex knowledge graphs and explore connections with confidence.
Share and build knowledge as a team
Share graph visualizations, add comments and notes, and build a shared view of connected data so teams can explore knowledge graphs together more effectively.
Built to adapt to your needs
Support multiple teams and evolving use cases on a single fully configurable platform, deployable on-premise or in the cloud, with scalable licensing and integrations that adapt as your needs change.
Discover Linkurious Decision Intelligence Platform. Powered by Graph Technology.
A modular platform for smarter, context-driven decisions.


Looking to embed graph visualization capabilities in your software?
Ogma is a high performance JavaScript library designed for large scale graph visualizations. It gives developers control over performance and user experience without starting from zero.
Understand the bigger picture at a glance
Unify disparate sources, explore relationships, and gain clarity through intuitive graph visualization and analytics.