 Network & IT Solution
Stay ahead of IT complexity
Keep control of even the most complex IT infrastructure. Get a unified, connected view of data, networks, and systems to help you with impact analysis, dependency mapping, and more.
Modern IT systems are full of critical connections. Can you see all of yours?
As IT infrastructure grows more complex, most tools fall short of showing how systems, services, and data actually connect. That leaves teams reacting to problems instead of preventing them.
Interconnectivity is both critical—and hard to manage
IT networks are full of connections and interdependencies that are key to optimizing networks, effectively managing infrastructure, and keeping your network secure. Not all tools give you the visibility you need.
Complex, growing IT systems
The number and types of elements making up an IT network tend to grow in number and complexity. IT management systems must be able to handle both current infrastructure and future growth.
Your data is scattered or siloed
Data sources often remain scattered walled off in silos, even as data undergoes transformation processes. Lack of visibility over data lineage can compromise data usability, quality, and security.
Changes carry hidden risks
Without the full picture of your network and systems, you risk missing critical information as you plan for changes or perform impact analysis.
Use cases
Linkurious adapts to your needs

Dependency mapping

Data lineage

Root cause analysis

IT infrastructure management

Impact analysis

Capacity planning & resource optimization
Benefits
Manage and optimize your whole IT network without blindspots
Efficiently optimize IT infrastructure, understand dependencies, and surface risks. All with a full view of each and every critical connection within your data, systems, and networks.
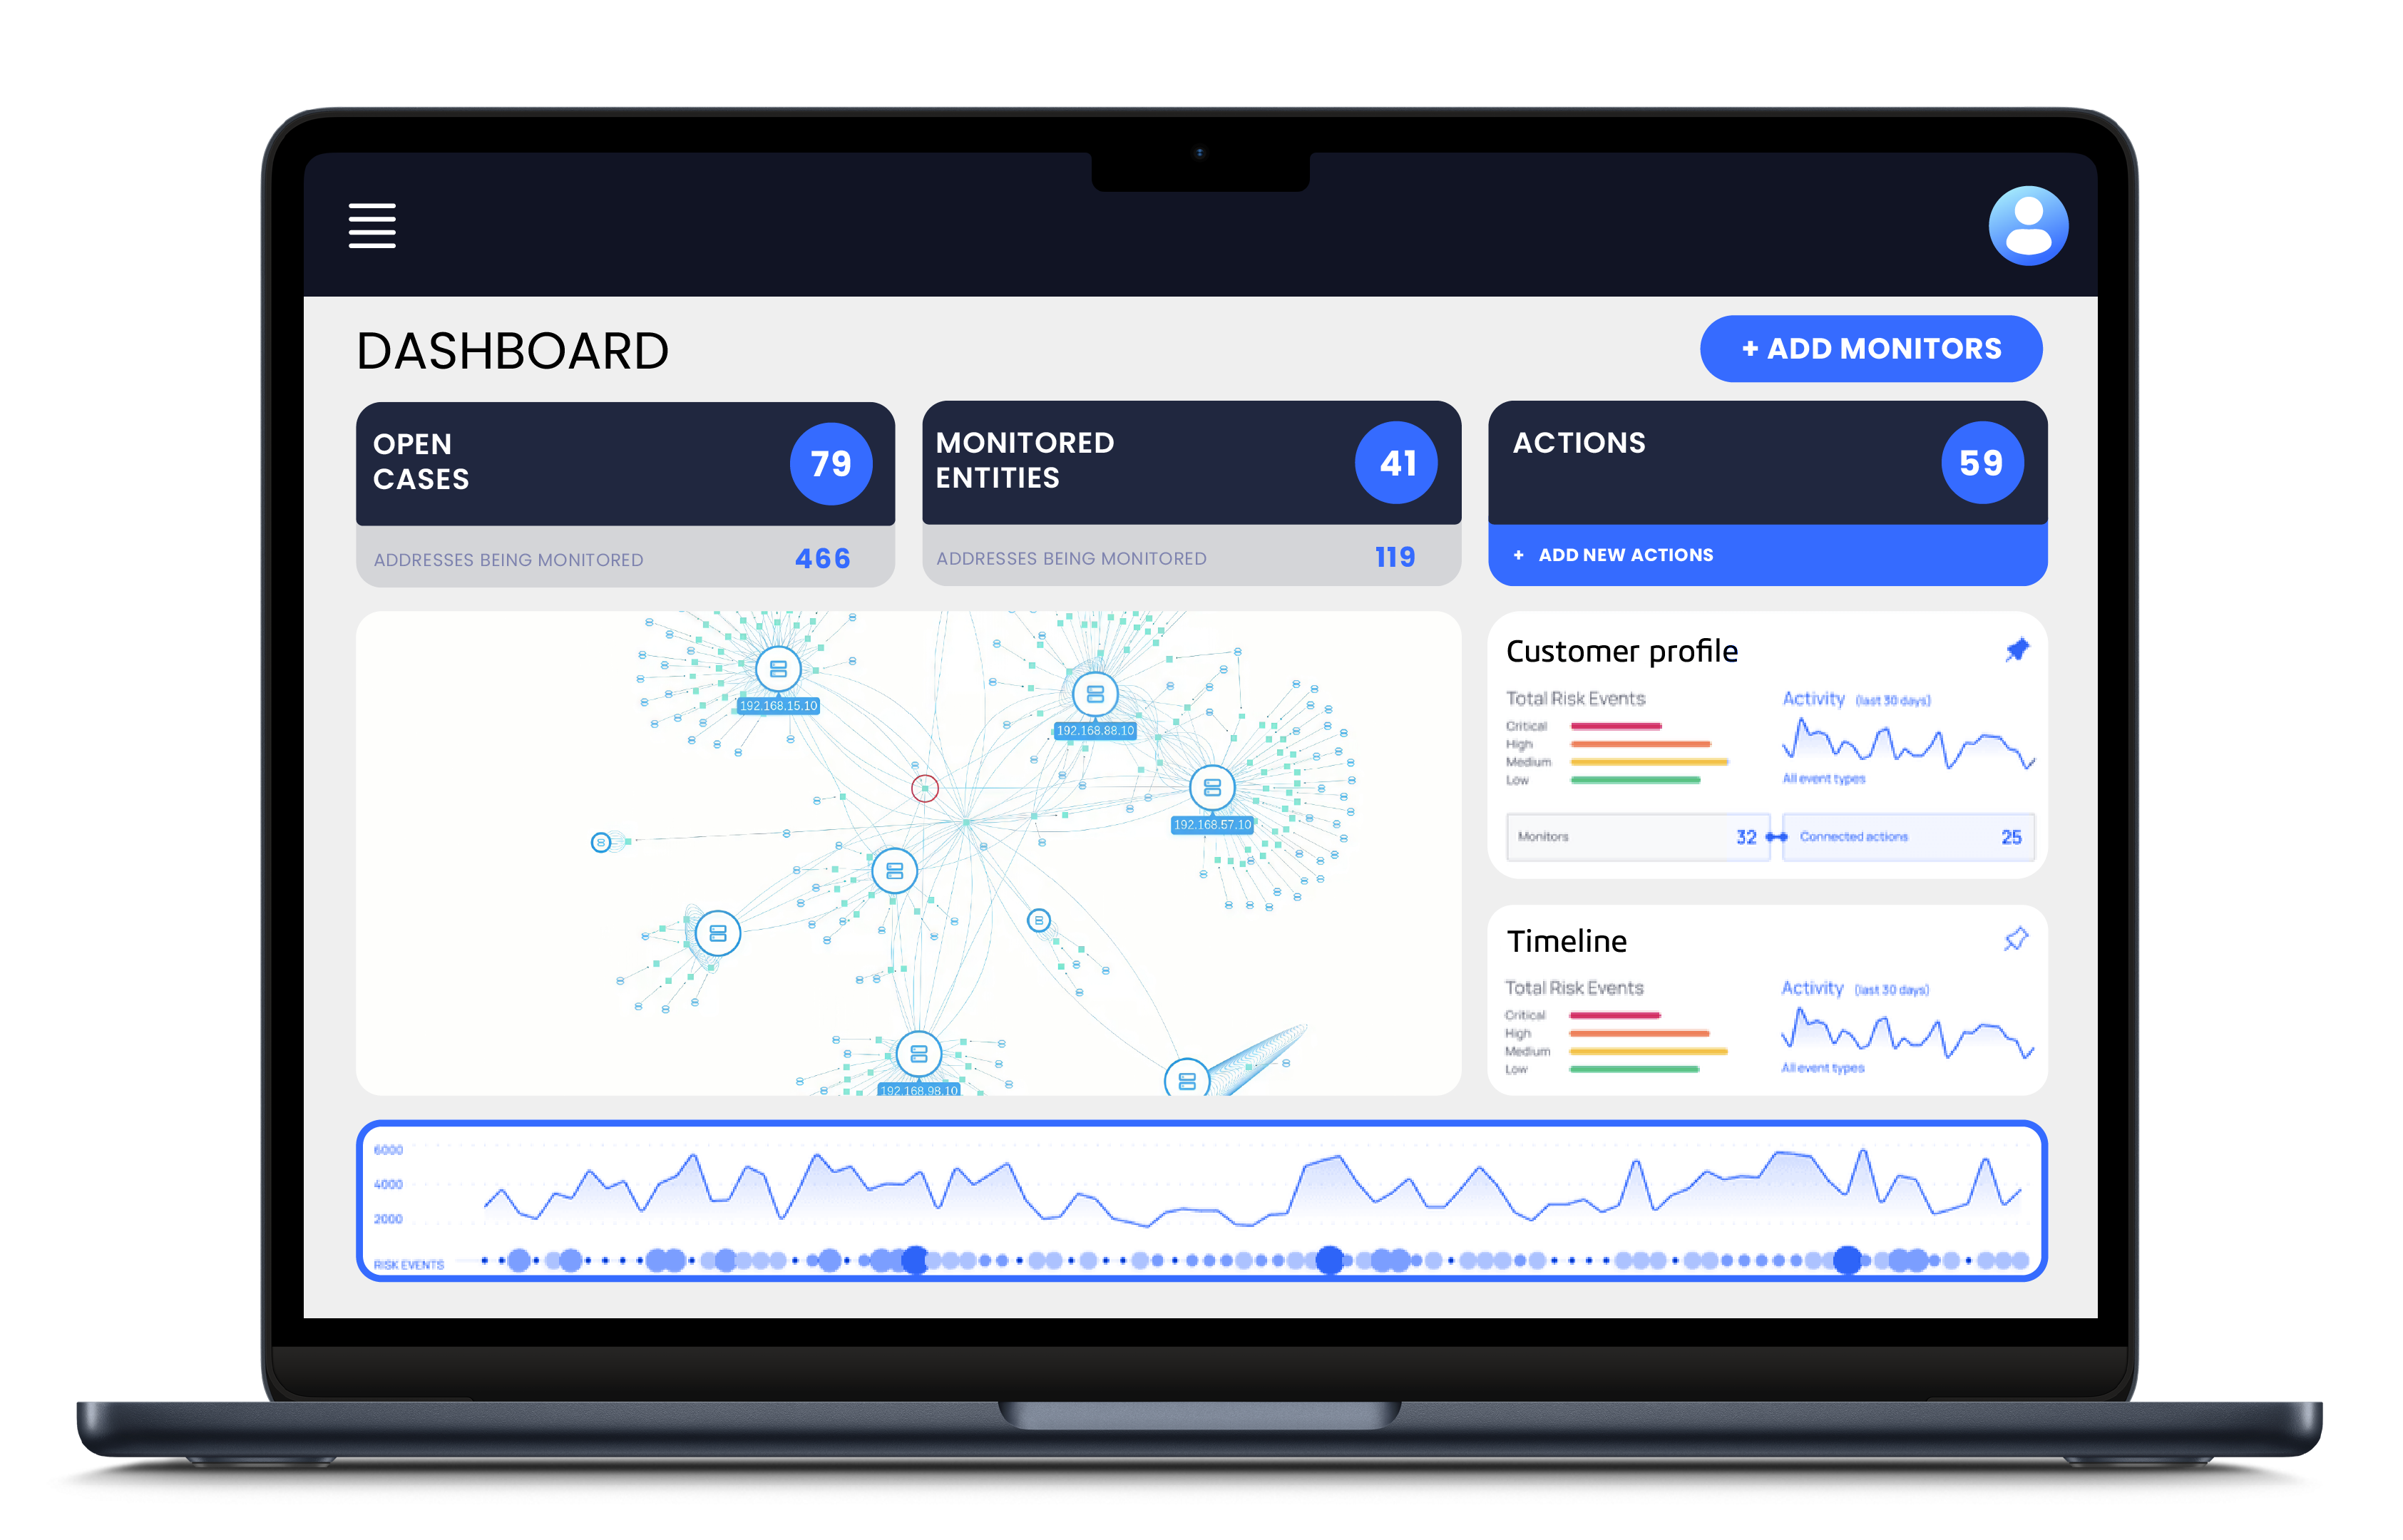
A comprehensive view of your IT network
Unify networks, systems, and data all in one place. See every connection at a glance, and never miss an anomaly, bottleneck, or critical dependency.
Quickly analyze dependencies and root causes
Swiftly and easily trace dependencies in your network, and identify the root cause of any issue without losing time.
Facilitate change management
Manage changes within your network and systems with full context and visibility, so you can anticipate blockers, bottlenecks, and risks.
Easily track data flows
Clearly and intuitively understand the relationships between data elements in even the most complex system, so you can make more informed decisions about how to manage your data.
Effortlessly work as a team
Tired of losing time working on complex processes and analyses? Fine-grained permissions and built-in collaboration tools make for seamless teamwork, and high-quality visualizations make findings and results explainable.
Discover Linkurious Decision Intelligence Platform. Powered by Graph Technology.
A modular platform for smarter, context-driven decisions.


Looking to add graph visualization capabilities in your network & IT software?
Swiftly embed graph visualization to make your data lineage and network operations visual, explorable, and intuitive for all users—no custom development necessary.
Ready to see the big picture of your IT systems and networks?
Get intuitive, actionable insights to better manage and optimize your IT systems and networks.