As the world has gone digital, many organizations now find themselves up to their necks in data. This wealth of data holds great potential, but the volume, diversity, and complexity of this data can feel like a double-edged sword for business leaders and data or IT executives. While it promises immense potential, without proper management, data can also lead to compliance and security risks, poor decision-making, and reputational damage.
In this context, data governance is essentially a requirement for most organizations today - but many run up against some serious challenges. Data is siloed across departments, platforms, locations, formats, and systems. It can be difficult to manage and contextualize information, to understand how data is interconnected, and to answer essential questions. This is where graph technology emerges as a powerful ally for data governance, offering a holistic and adaptable approach to understanding, managing, and harnessing data.
In this article, we’ll explore how graph technology can help organizations move towards more efficient data governance. We’ll take a look at several data governance use cases where graph technology’s capabilities really shine and can add value to your organization’s processes and capabilities.
Before we dive in, let’s take a moment to make sure we’re all on the same page as we define data governance.
Data governance serves as the guiding framework for how an organization manages, secures, and ensures the quality of its data assets. It's essentially the playbook that outlines the rules and procedures for handling data within an organization. In today's data-centric world, data governance is not merely an option—it's a vital necessity.
Data governance is responsible for:
- Defining data ownership
- Documenting data definitions and metadata
- Establishing rigorous data quality standards
- Implementing access controls to safeguard sensitive information
It creates a structured approach to data management, ensuring that data remains a strategic asset and aligns seamlessly with the organization's business objectives.
Essentially, it’s the foundation upon which an organization's data strategy is constructed. It brings structure to the vast landscape of data, facilitating its smooth flow throughout the organization, empowering decision-makers with reliable insights, and providing protection against potential data-related risks.
But in order to achieve robust data governance, organizations need a clear, accurate, and comprehensive view of their data. That’s where graph technology comes in.
Graph technology stores and analyzes data in a way that empowers organizations to be far more efficient in their data governance as it models data as a network and specifically focuses on the relationships within data. In a graph database, data is structured as nodes and edges. Nodes represent individual data points, while edges represent how those nodes are connected. Graphs thrive on connected data, and excel at breaking down silos, meaning they offer greater visibility and flexibility than traditional data management approaches.
The graph approach offers several key advantages for data governance.
Data governance is an ongoing process by nature. And with data constantly evolving and organizations needing up to date information to function efficiently, accessing real-time insights is essential. Graph technology provides the agility organizations need. It allows for dynamic querying and analysis, enabling organizations to swiftly identify data quality issues, access control violations, and compliance breaches in real-time while greatly reducing manual work.
As data grows exponentially, scalability becomes a major concern. Traditional relational databases may struggle to handle the complexity of relationships in large volumes of data, leading to performance bottlenecks. Graph databases, on the other hand, are inherently scalable when it comes to connected data, making them well suited for the ever-expanding data governance landscape. Whether it's managing data from multiple sources or incorporating new data elements, graph technology scales seamlessly.
Data governance requirements can vary widely between industries and organizations. What works for one might not work for another. Graph technology is particularly flexible and adaptable. Whether it's designing data models, defining access controls, or setting up compliance rules, graph databases offer the flexibility to tailor data governance practices precisely to an organization's requirements.
As graph technology has evolved, user-friendly tools are making it more and more accessible to all kinds of users. As an example, Linkurious Enterprise graph visualization and analytics software features an intuitive interface that enables both technical and non-technical users to gain access to the insights within their data. Graph visualizations are especially useful, since understanding how data is interconnected is crucial for data governance. With a tool like Linkurious Enterprise, this information is available at users’ fingertips, no matter the volume and complexity of the data.
Now let’s get into specifics. There are a number of data governance tasks that can be facilitated with graph. Let’s look at four key data governance use cases for graph technology.
Data privacy and the risk of data breaches are primary concerns for organizations across industries. Safeguarding sensitive information is therefore a top priority. Graph technology can help enhance data security and privacy:
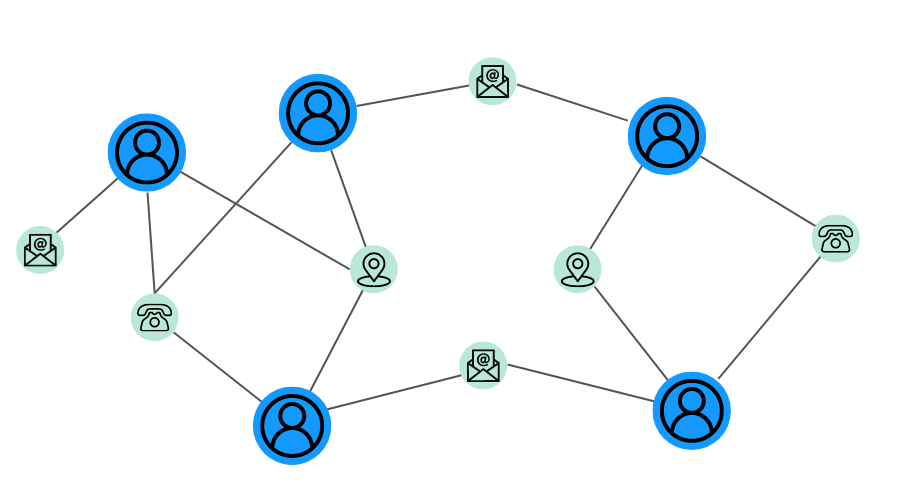
- Anomaly detection. Detecting anomalies in data access patterns helps identify potential security threats. Graph technology enables organizations to model and analyze user behavior within the data ecosystem. By creating profiles of typical data access patterns, graph technology can raise alerts when deviations occur, indicating possible security breaches or unauthorized data access.
- Ensuring data privacy. Protecting data privacy is a basic requirement for all organizations. Graph technology can provide a detailed audit trail of data access and modifications. By leveraging graph technology's ability to track and visualize data access, organizations can prove their commitment to safeguarding privacy and avoid potential legal consequences.
Data quality is the foundation upon which effective data governance is built. Ensuring that data is accurate, consistent, and reliable is not only essential for decision-making but also critical for maintaining compliance and building trust with stakeholders. Graph technology plays an important role here.
- Data profiling and entity resolution. Graph technology lets you create detailed profiles of nodes. These profiles include information about data types, ranges, and constraints. With this information, it becomes possible to identify data anomalies or outliers, such as missing values or data that falls outside predefined ranges. Graph technology also supports entity resolution, enabling organizations to rectify data quality issues.
- Real-time data monitoring. Ensuring data quality is an ongoing process. Graph technology enables real-time data monitoring, allowing organizations to continuously assess data quality. Alerts can be set up to notify key stakeholders when data quality thresholds are breached, enabling rapid response to data issues.
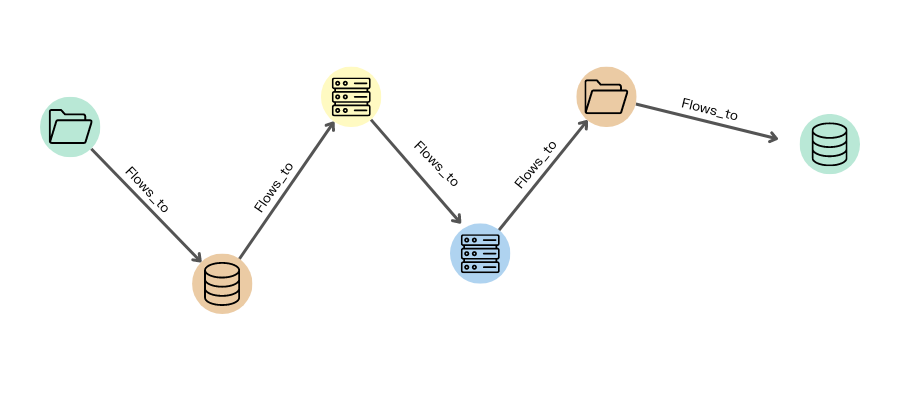
One of the cornerstones of effective data governance is data lineage—the data lifecycle that includes the data’s origins and where it moves over time. For large organizations, that lifecycle can be complex as data flows from files to databases or reports, while going through various transformation processes. Data lineage provides clarity about how data is used within an organization, while also being instrumental in ensuring data quality, compliance, and security. Graph brings a few advantages to the table for data lineage:
- Clear visualization of data flows. Graphs naturally represent both the data elements and how they flow through a lifecycle. Graph databases, paired with a graph visualization tool, therefore create an intuitive and visually compelling map of how data moves through the organization. This makes it easier to identify potential bottlenecks, duplication, or inconsistencies in the data flow.
- End-to-end traceability. Graph technology provides a comprehensive view of data transformations, from source systems to analytical outputs. This makes it possible to take a look upstream at data history to track data changes, transformations, and the impact of these changes on processes in real-time.
- Impact analysis. In data governance, understanding the potential downstream consequences of data changes is vital. Graph simplifies impact analysis by allowing organizations to trace the potential impact of any modifications to data elements, schemas, or access controls across the entire data ecosystem.
Most organizations are subject to some kind of regulatory requirements when it comes to their data. Two examples of this are the General Data Protection Regulation (GDPR) in the EU, or Health Insurance Portability and Accountability Act (HIPAA) in the USA. Failing to comply with these regulations can result in hefty fines and damage to an organization's reputation. Fortunately, graph technology can help you stay compliant since it provides a comprehensive view of your data, enabling you to quickly answer questions around compliance matters.
- Real-time monitoring and auditing. Compliance is not a one-time task; it's an ongoing process. Graph technology enables organizations to monitor compliance in real-time by tracking data access, modifications, and user behavior. This lets organizations more effectively identify and rectify compliance breaches promptly and at scale.
- Impact analysis on compliance changes. When regulatory requirements change, organizations need to assess how these changes impact their existing data governance practices. Graph technology simplifies this task by enabling organizations to model and trace the impact of regulatory changes across their data ecosystem.
- Data provenance. Graph technology excels at capturing and visualizing data provenance, creating a transparent and easily understandable record of how data has been handled and who has access to it.
Data governance is an integral function of virtually every modern organization. As businesses generate more and more data, traditional approaches can struggle to meet organizations’ data governance challenges.
Graph technology provides powerful capabilities for organizations looking to improve the efficiency of their data governance across a range of use cases—from understanding and tracking data lineage to managing security policies, satisfying regulatory requirements, or improving overall data quality. In embracing graph technology, organizations can help themselves stay ahead of the growing complexity of their data assets. Explore the possibilities this technology has to offer your organization.
A spotlight on graph technology directly in your inbox.