A graph database, or graph DB, collects and stores data as a network of entities and relationships, emphasizing the connections within the data. A foundational piece of any graph technology application, graph databases excel at modeling real-world scenarios in highly connected data.
Unlike its tabular counterpart, a graph database is designed to thrive on relationships. It's a dynamic, flexible, and powerful tool that helps navigate complex networks of data with ease. In this article, learn about the fundamentals of graph databases: how graph data is structured, how graph DBs differ from relational databases, examples of use cases, and more.
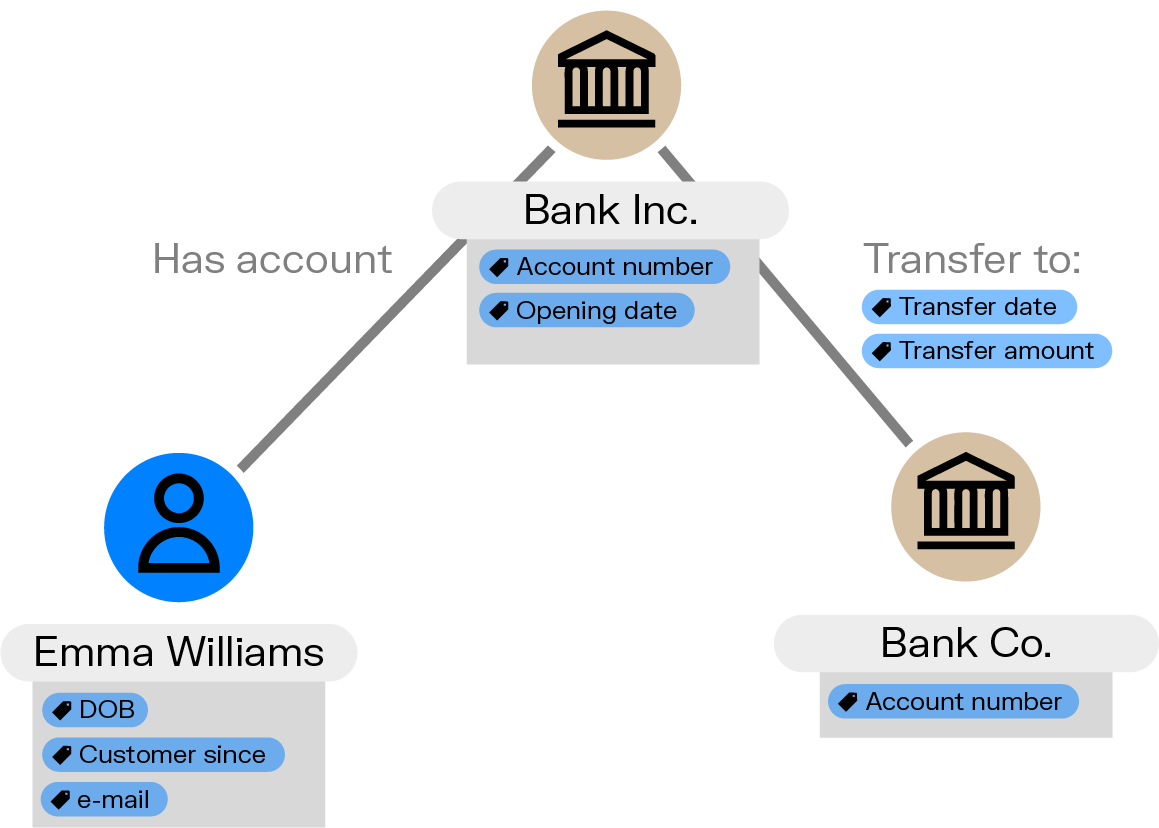
A graph database is where nodes, edges, and properties are stored. Each node represents an entity, such as a person, a bank account, an address - or any other piece of data. Each edge - which are also referred to as relationships - represents how two nodes are linked to each other, for example, person “a” owns bank account “b”.
In a graph data model, each node and edge can have properties, which describe the entity or the relationship. For example, a node representing a person might have properties such as name, age, and address, while an edge representing a "transfers to" relationship might have properties such as date of transfer or amount of funds transferred.
In contrast to a traditional, table-based model, graph data is stored without a predefined model, making it highly flexible. This method of data storage allows for efficient traversal of the graph structure. Graph databases use various data structures and indexing techniques to make this traversal lighting fast, even with large and complex datasets.
Graph query languages let you access the information within a graph database. A query language makes it possible - even easy - for a developer to manipulate graph data and ask specific questions (queries) about the network within a graph DB. Commonly used graph query languages include Gremlin, Cypher, and GQL.
Graph algorithms are sets of instructions of procedures designed to solve a problem or perform a task on a graph data structure. They can be applied to a graph database to analyze patterns and understand relationships. They do this by exploring the paths and distances between nodes, how nodes are clustered, and the importance of nodes within the network.
There are many, many different types of graph algorithms. You can read about some of the most common graph algorithms here.
What exactly differentiates a graph database from a relational database?
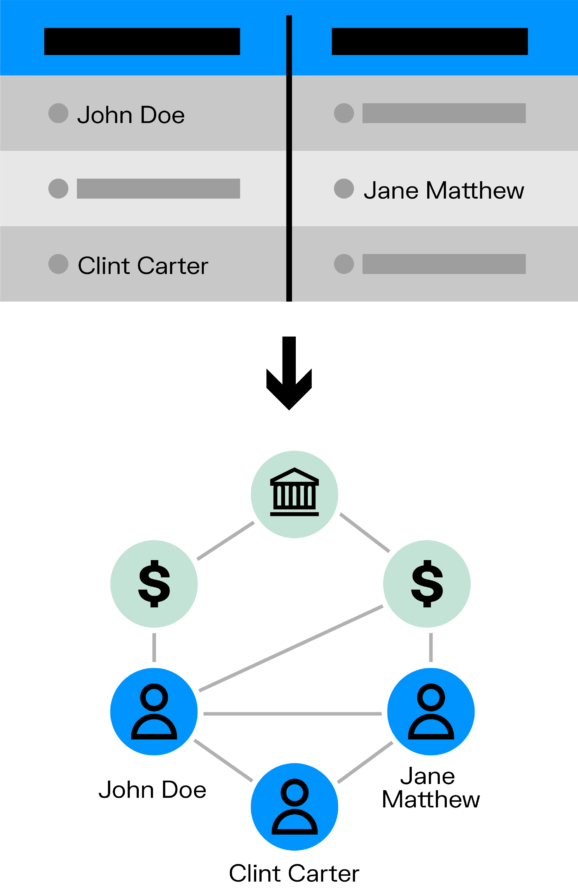
Relational Database Management Systems (RDBMS) are structured as tables with rows and columns. They are well suited for many use cases where data is consistent and not highly connected. They are very good for routine data analysis, for example, or fast operations at scale such as verifying that a transaction belongs to a valid customer.
These databases come with drawbacks, however. They perform poorly for relationship queries. Going from table to table via “joins” has an exponential computational cost, making this kind of operation impractically slow.
RDBMS also have low flexibility. They are hard to evolve, and it’s complex to manage relationships across tables. It tends to be difficult for RDBMS to adapt to domains with complex connected data.
The graph data model, on the other hand, is particularly well-suited to store and organize data where connections are as important as the data points. Connections are stored and indexed as first-class citizens, making it interesting for many applications, such as fraud and financial crime investigations, cybersecurity or intelligence analysis where relationships are essential information.
Some types of questions are particularly well suited for graphs: How are X and Y connected? What is X connected to? What is the role of X person in this network? The world's biggest companies have been relying on graphs for years now to answer these kinds of questions, with systems such as Google’s “Knowledge Graph”.
There are several types of databases that are designed for graph data, which include property graph databases, RDF databases, multi-model databases, and high-performance computing databases.
Some examples of the most popular graph databases today include:
- Neo4j
- Azure Cosmos DB
- Amazon Neptune
- Memgraph
- JanusGraph
- Stardog
The graph database space is increasingly dynamic, with new databases coming on the market. Most recently, Google announced their own graph database.
For more details about the different graph databases on the market - and other tools within the graph technology space - read the overview of the graph technology landscape.
How do you extract insights from the data in your graph database?
Graph analytics offers a valuable set of methods to gain insights from connected data. For example, there are many graph algorithms, derived from graph theory and social network analysis, that can be used to identify communities, to spot highly connected individuals or to understand flows of information through a network.
Graph analytics helps data scientists and data-driven analysts answer questions or make predictions using graph data. Read our deep dive on graph analytics.
Graph databases have some key advantages over more traditional analytics models. They answer some of today’s most pressing data challenges, such as:
- Increasing amounts of data
- Organizations needing to use more data sources
- Evolving data structures
With graph technology, you can combine multi-dimensional data, including demographic, temporal, or geographic data. You can also combine internal and external data sources.
A graph database is able to aggregate data from multiple sources and formats into a single, comprehensive data model that can scale up to billions of nodes and edges. Breaking down silos between data sources opens the door to performing very powerful analysis.
By de-siloing data and offering a lot of flexibility, graphs enable you to extract insights that are hard to come by with other approaches.
Although they are a relatively new technology, graph databases are proving to be a major asset across a broad range of industries. Their ability to handle large quantities of data efficiently and to analyze even the most complex relationships make them attractive for a variety of use cases.
A graph database can be used to model relationships between people and organizations to detect suspicious financial activity. By analyzing transaction patterns and network structures, a graph database can help financial institutions identify potential money laundering schemes and take appropriate action.
A graph database could be used to detect fraud by analyzing patterns of behavior and relationships between entities. A graph database can identify anomalous behavior and connections, helping organizations prevent and detect fraudulent activity.
By modeling relationships between people, organizations, and events, a graph database can deliver insights into complex networks. Patterns of communication, financial transactions, and other data can be used to help intelligence agencies understand and respond to threats.
Graph databases can model relationships between devices, users, and activity logs to detect and prevent cyberattacks by identifying patterns of behavior and potential vulnerabilities.
Graph databases can be used to model relationships between genes, proteins, diseases, and other biological entities to understand the underlying causes of diseases and develop more effective therapies.
By modeling relationships between people, locations, and diseases, graph databases can help public health officials understand patterns of disease transmission to respond to outbreaks and prevent the spread of disease.
A graph database can model relationships between hardware, software, and users to analyze complex IT networks and identify potential points of failure, optimizing system performance and preventing downtime.
Graph databases can model relationships between suppliers, products, and customers to analyze complex supply chain networks, identify potential bottlenecks, and optimize efficiency.
For many of these use cases, graph databases can be leveraged alongside machine learning, providing better analytical accuracy and deeper insights.
While the graph approach offers a unified data model, finding insights within the enormous volume of data remains a challenge for analysts. Using link analysis or a graph visualization tool like Linkurious on top of a graph database enables you to search, analyze, and visualize your graph data.
Graph visualization - also called network visualization - helps easily identify key insights. It is also particularly useful in situations where end-users need to understand and identify complex connections, but do not have strong technical skills.
Linkurious connects to a graph database, providing real-time access to your data. Styling and filtering capabilities reduce the noise, highlight key elements, and analyze the data faster. For organizations dealing with massive volumes of connected data, it helps:
- Reveal connections and patterns that were otherwise hidden in silos through a unified graph view of your data
- Remove the difficulty of tracking information scattered across tools and tables, letting you find hidden insights faster.

Linkurious is a software company providing technical and non technical users alike with the next generation of detection and investigation solutions powered by graph technology. Simply powerful and powerfully simple, Linkurious helps more than 3000 data-driven analysts or investigators globally in Global 2000 companies, governmental agencies, and non-profit organizations to swiftly and accurately find insights otherwise hidden in complex connected data so they can make more informed decisions, faster.