Anyone working with supply chains today knows they can be extremely complex. They are vast, far-reaching, and international, connecting many disparate places, people, and parts. They are also powerful: supply chains are what let you buy things manufactured in Turkey, Vietnam, or Germany in stores right in your neighborhood - or have those products delivered straight to your door.
But complex supply chains also come with challenges and risks--from out-of-stock components to shifting costs and buying patterns, to name a few. To efficiently manage supply chains, organizations need transparency, traceability, and an end-to-end view of all the elements in the chain. And that’s where graph technology comes in.
Graph analytics and visualization can reveal what’s happening in a supply chain in real time. Graph helps quickly identify key risks, spot potential bottlenecks, and develop contingency plans. Read on for an overview of exactly how graph can help you gain visibility to more effectively manage your supply chain challenges.
Managing a supply chain isn’t just about moving things from point A to B. It’s about maintaining control over a shifting web of relationships, timelines, and regulations. Some of the most common issues include:
- Lack of visibility and transparency: Each stakeholder, supplier, manufacturer, shipper, runs on different systems. Connecting the dots across all of them is often messy and difficult.
- Risk management: Natural disasters, political unrest, supplier failures: all can seriously disrupt your operations.
- Volatile demand: Plenty of things can cause buyer patterns to change: political or economic changes or crises, global pandemics… Organizations need to be able to weather these shifts as efficiently as possible to minimize financial loss.
- Managing costs: Balancing the trade-off between cost and quality in supply chain management can be challenging, especially when prices of raw materials, shipping, or labor fluctuate unpredictably.
- Regulatory compliance: Many industries deal with restricted substances somewhere along the supply chain. Manufacturers must keep careful track of them, or in some cases need to make sure certain restricted substances don’t end up in their supply chain.
In short: it's a lot. But it’s also where a supply chain graph can truly make a difference.
Graph technology thrives on connections and complexity - two things that are inherent in supply chain management. Let’s do a quick review of what we mean when we talk about graph technology.
A graph data model organizes information as interconnected nodes and edges, making relationships as important as the data itself:
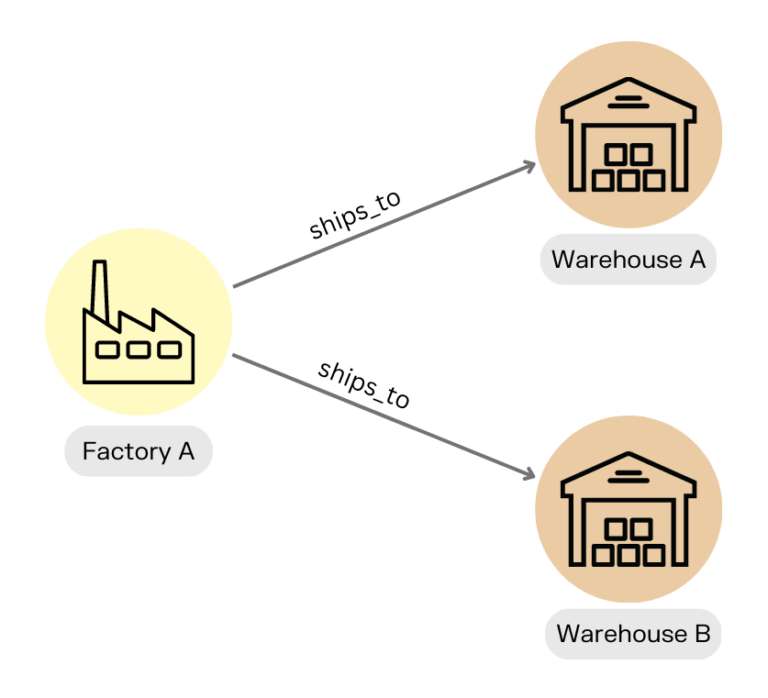
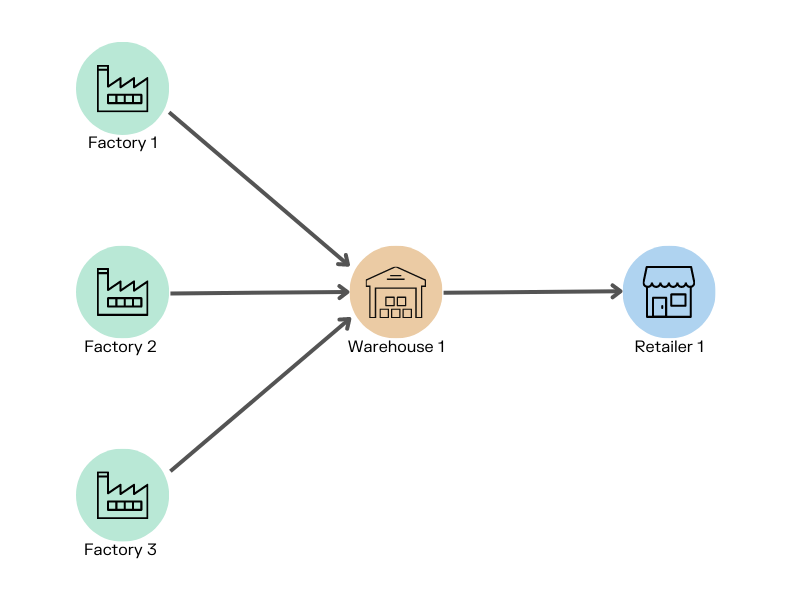
- Each node represents an entity, such as suppliers, manufacturers, warehouses, products, retailers, among others.
- Each edge is a line that connects two nodes, defining how they are linked to each other (e.g. supplies, manufactures, ships to, stores, orders from, etc).
- Nodes and edges also have properties: additional information associated with them. All this information is stored in a graph database.
For example, a supplier node might connect to a manufacturing plant, which links to a warehouse and finally to retail stores. If the supplier is delayed, the graph instantly shows how that disruption could affect production and deliveries downstream.
When you’re working with many different stakeholders and several data sources, the relationships within that data can be highly complex. By analyzing data as a graph, it’s possible to determine the closeness of different entities, as well as how entities are connected. Graph analytics provides algorithms that help data-driven analysts answer questions or make predictions.
By comparison, traditional analytics are more focused on individual data points, either considered separately or aggregated. It can be time-consuming and computationally demanding to analyze relationships within data using traditional methods.
Graph technology is a powerful solution for managing supply chain challenges thanks to its ability to bring together various data sources and provide real-time, end-to-end visibility of supply chain operations.
In traditional supply chain management systems, based on relational databases, data is often siloed and disconnected. This makes it difficult to gain a comprehensive view of the entire supply chain.
Graph analytics and visualization tools solve this problem by representing data as a network of interconnected nodes, which provides a visual representation of the relationships between suppliers, manufacturers, distributors, and customers. Graph visualizations are easier to analyze and understand than traditional systems, giving supply chain managers a unified view of the entire operation.
Some organizations go further by building supply chain knowledge graphs, an enriched version of a graph model that incorporates semantics, business rules, and metadata. These allow for more advanced reasoning, complex queries, and predictive modeling.
Using graph, analysts can quickly and easily identify bottlenecks, track shipments, and monitor supplier performance. For example, if a supplier experiences a production delay, graph technology can quickly highlight the downstream impact on other parts of the supply chain, allowing companies to proactively respond and minimize disruptions.
Graph technology can also help identify and manage risk. By analyzing the full supply chain, graph can help identify weak spots and vulnerabilities so organizations can devise contingency plans before problems arise.

Let’s look at some specific examples of how graph analytics and visualization can be applied to supply chain use cases.
Graph technology can be applied in many ways to improve supply chain management. Here are a few examples of how you can use graph to reduce losses, decrease risk, and better optimize your supply chain.
Graph technology provides a real-time, end-to-end view of the supply chain, from suppliers to customers. By representing the supply chain as a network of interconnected nodes, graph technology provides a visual representation of the relationships between suppliers, manufacturers, distributors, and customers. This helps analysts spot delays, track products, and assess supplier activity more easily.
Graph can also be used to track products through the supply chain, from raw materials to finished goods. By capturing and analyzing data at every step of the supply chain, graph technology can provide full traceability, enabling companies to ensure that products meet quality standards and regulations, including tracing restricted substances.
In industries like food and beverage, where traceability is often mandatory, this kind of visibility becomes essential.
The graph-powered visibility also supports compliance audits and fraud prevention. For example, graphs can help reveal unusual supplier behavior, such as duplicate vendors or circuitous shipping routes, that might indicate grey-market activity or regulatory breaches.
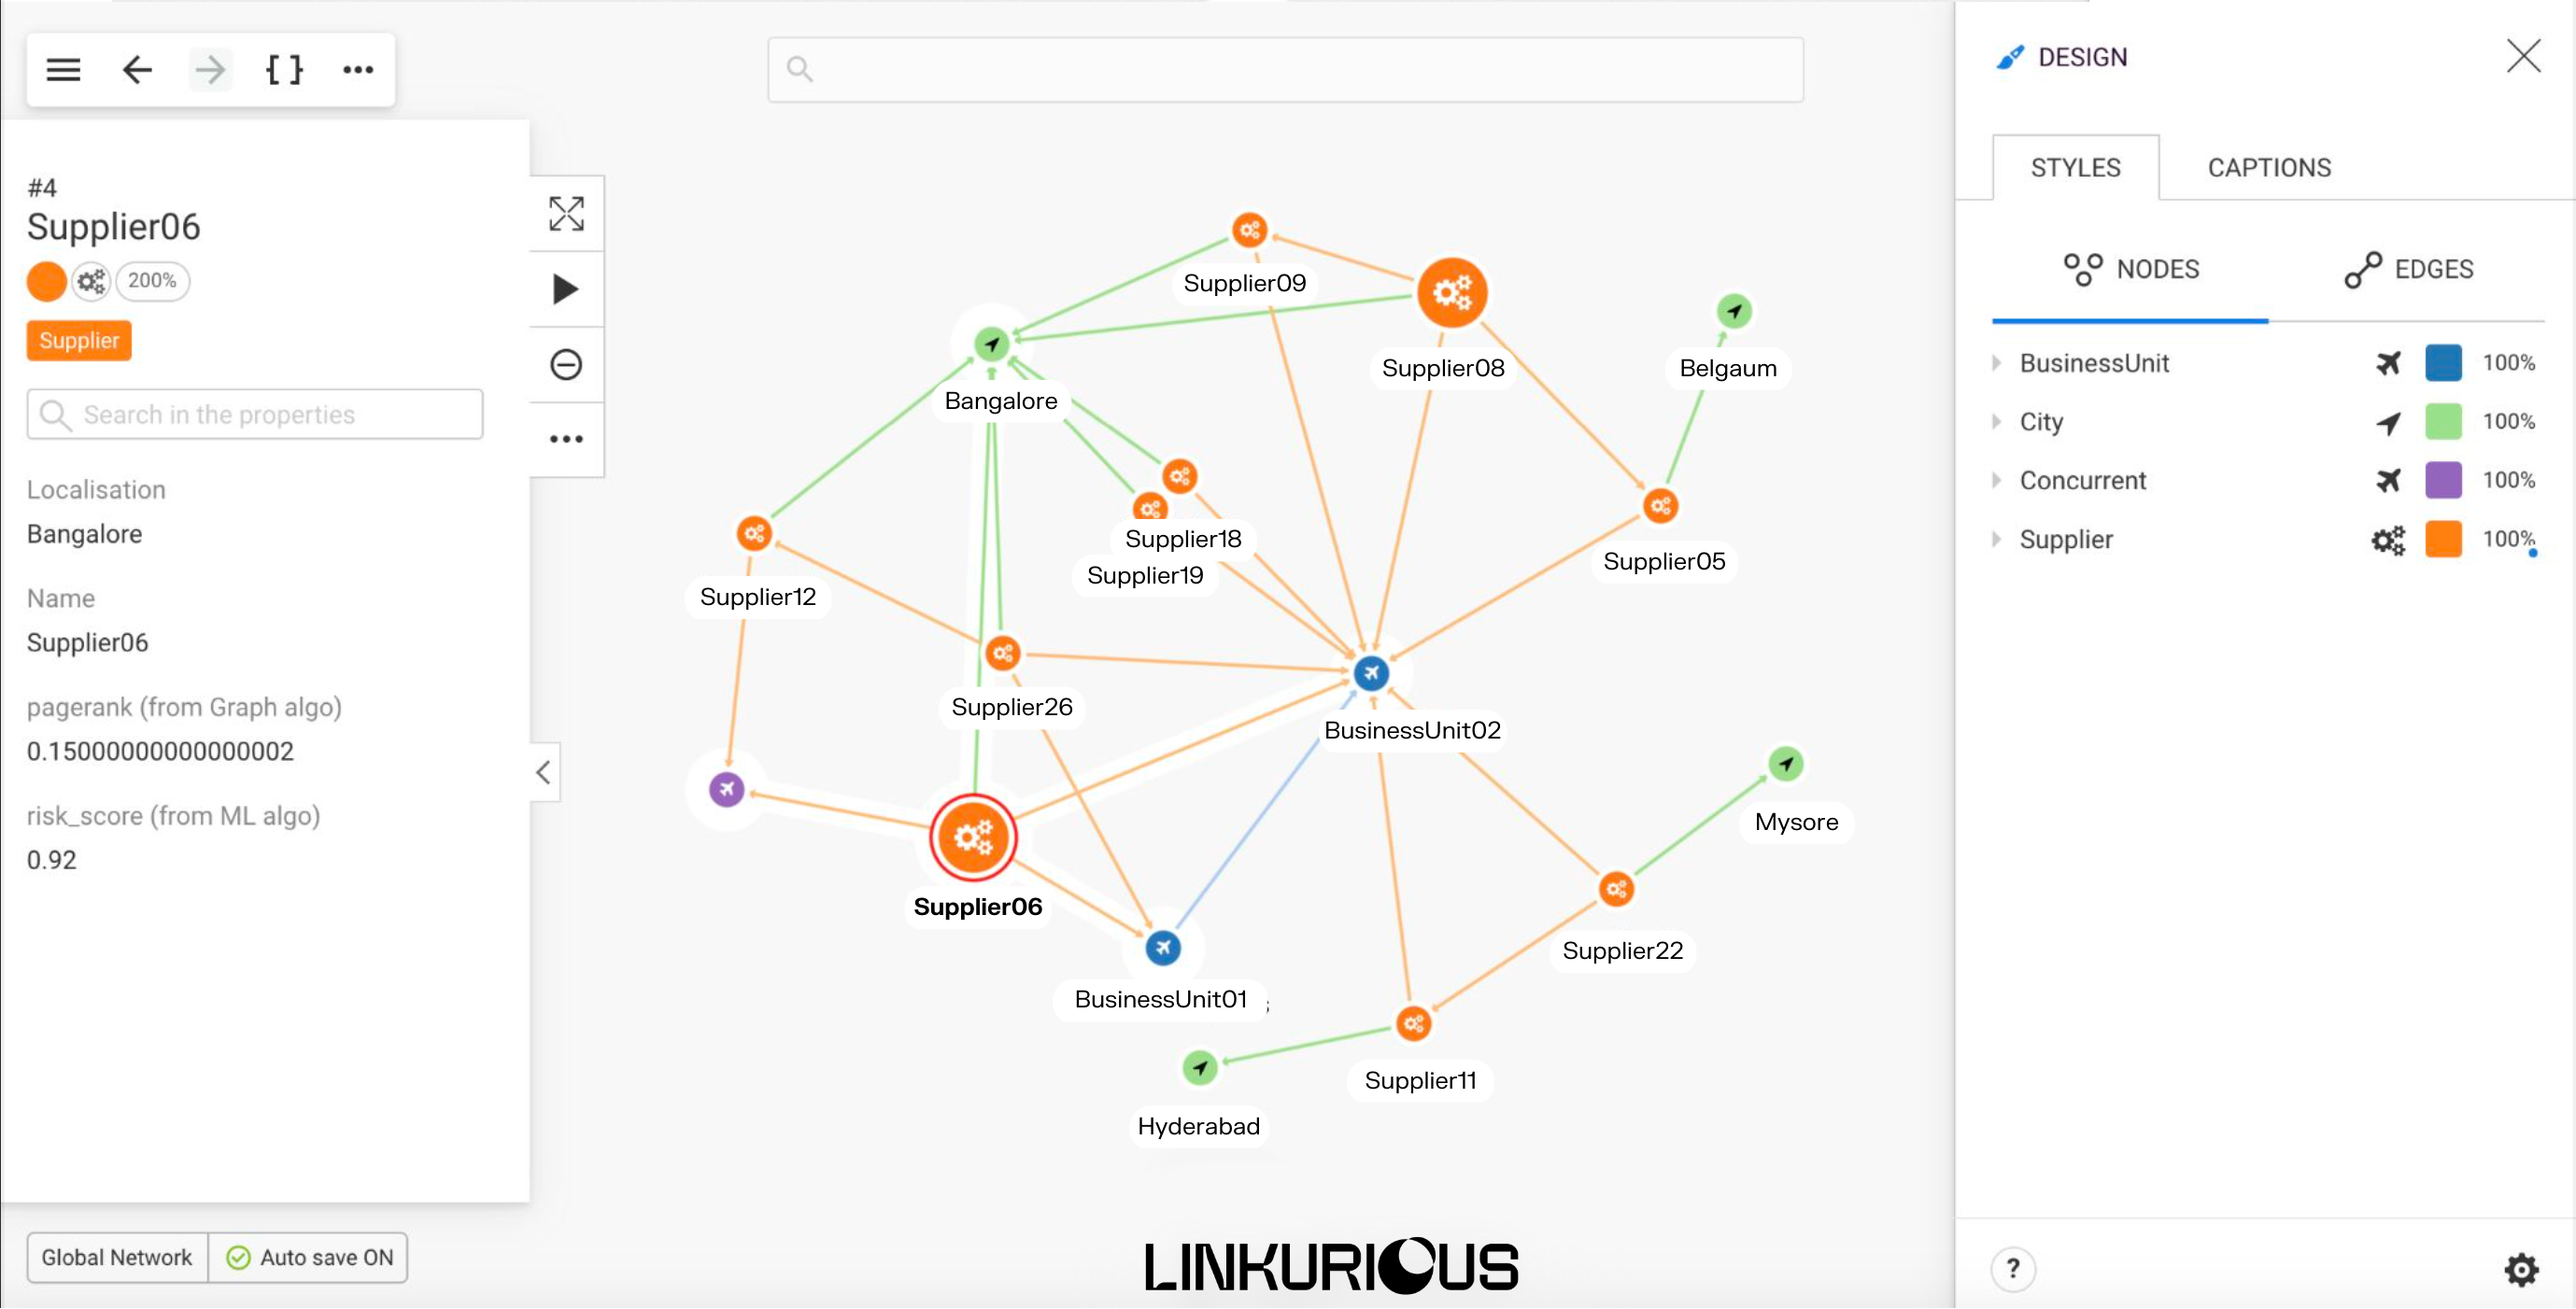
Supply chain management involves identifying, assessing, and mitigating potential risks that could disrupt the flow of goods and services. Graph visualization can help organizations to identify potential risks in the supply chain by mapping out the relationships between suppliers, manufacturers, warehouses, transportation providers, customers, etc.
This can include analyzing the dependencies between nodes, as well as identifying single points of failure or bottlenecks that could disrupt the flow of goods and information. This can be done using a betweenness centrality algorithm, which quickly lets you visualize in your graph the most highly connected nodes. The visualization would show, for example, which suppliers would most impact operations if they were to change their product or cease production.
Once potential risks have been identified, organizations can use graphs to assess the likelihood and impact of those risks on the rest of the supply chain. And they can also be used to develop and implement contingency plans to mitigate the impact of identified risks. For example, a graph could be used to identify alternative suppliers or transportation routes that could be used in the event of a disruption.
When something goes wrong in a supply chain, it’s not always obvious, especially when bad actors try to hide it. Graph analytics makes it easier to spot:
- Unusual connections between unrelated suppliers
- Changes in normal delivery paths
- Spikes in risk scores for specific nodes
This proactive layer of intelligence adds security and saves time investigating irregularities.
As regulations grow stricter and sustainability gains importance, companies are under pressure to show accountability in their supply chains. Graph visualization can help:
- Monitor vendors for environmental or labor violations
- Trace the origin of materials for sustainability reporting
- Detect fraud or non-compliant substitutions in products
With real-time tracking and historic traceability, graph tech supports both proactive and audit-ready compliance.
Accurate demand forecasting allows companies to ensure that they have sufficient inventory to meet customer demand while avoiding overstocking and waste. Graphs can be used to analyze and predict demand patterns by considering various factors, such as past sales data, seasonality, and external events (natural disasters, pandemics).
One reason graph technology performs well for demand forecasting is that it can be used to integrate data from a variety of sources to provide a more comprehensive and accurate picture of demand.
Graph technology is also particularly well suited to capturing complex relationships between different data points, such as the relationship between sales and customer demographics, seasonality, and marketing efforts. By representing these relationships visually, graph technology can help supply chain professionals identify patterns and trends in demand that may not be immediately apparent in tabular data. It also provides a flexible and intuitive platform for data analysis, allowing supply chain analysts to easily create visualizations, perform ad-hoc analysis, and identify patterns and trends in demand.
Graph analytics and visualization is a powerful solution for addressing many of the key challenges of managing today’s vast and complex supply chains. It lets you go beyond the individual data points to gain deep insights into the connections within your data. By offering end-to-end visibility and making sense of even the most complex relationships within your supply chain, graph can help better manage both risk and cost.
Linkurious offers powerful and easy to use, off-the-shelf graph analytics and visualization software that provides a holistic view of the entities most relevant to your business and their relationships. It enables both technical and non-technical users to uncover key information and insights within their supply chain data. Learn more about it here.
A spotlight on graph technology directly in your inbox.