Navigating supply chains in the age of tariffs: How to adapt using graph technology
Managing global supply chains is challenging in the best of circumstances. Now, with the imposition of new, sweeping tariffs by the United States administration - and the pauses that have sometimes quickly followed - supply chain managers are facing challenges and a level of unpredictability rarely seen before.
This, of course, comes on the heels of major supply chain upheavals due to Covid-19 just five years ago. As the world continues to move through a period of uncertainty and profound geopolitical transformations, the ability to maintain visibility over supply chains and react to change quickly are critical for today’s global organizations.
There is no silver bullet to make the uncertainty of quickly changing, on-again-off-again tariffs go away. But adopting the right reflexes and making the most of technology tools can make it easier to successfully weather changes and build actionable contingency plans. In this article, we take a brief look at the challenges facing supply chain managers in the current context. And we explore how adding graph technology to your supply chain tech stack can help you stay agile and responsive, even in difficult circumstances.
A supply chain encompasses the entire network of entities, resources, and activities involved in the creation and sale of a product, from sourcing raw materials through production and delivery to the end customer. In today's global economy, supply chains span continents, involving numerous companies, regulatory environments, transportation systems, and currencies.
The complexity of modern supply chains stems from their global reach and interconnected nature. A single finished product might contain components manufactured in dozens of countries, each with their own production timelines, quality standards, and regulatory requirements. For example, Apple relies on people and parts from over 50 countries to build its devices.
These global networks offer significant advantages like access to specialized expertise, cost efficiencies, and expanded markets, but they also create complex webs of dependencies. A change or disruption at any point can send ripple effects throughout the entire network, often with unpredictable consequences.
The scale is equally impressive: major retailers manage relationships with tens of thousands of suppliers, while manufacturers coordinate multiple tiers of component providers. If you look at automobiles sold in the US, for example, the supply chains behind them consist of dozens of suppliers who provide thousands of parts and components, moved around by many modes of transportation. To give a sense of scale, one car produced by Toyota contains about 30,000 different parts. All this complexity must be managed while maintaining competitive pricing, consistent quality, and reliable delivery schedules
Even under optimal conditions, supply chain professionals face a whole host of challenges, such as:
Supply chains typically involve multiple organizations using different systems and technologies. This can create information silos where data about inventory, production status, or shipments may not be easily accessible across the network. Many companies report having clear visibility only into their immediate suppliers, but may lack information on the full multi-tier supply network.
Supply chains are vulnerable to numerous risks, including (but certainly not limited to):
- Natural disasters affecting production facilities or transportation routes
- Geopolitical tensions disrupting international trade
- Supplier financial instability or bankruptcy
- Quality control failures requiring recalls
- Cyberattacks on critical infrastructure or systems
Consumer preferences change quickly, making demand forecasting difficult. Inaccurate forecasts lead to either excess inventory (tying up capital) or stockouts (losing sales and damaging customer relationships).
Companies face constant pressure to reduce costs while maintaining quality and service levels. This requires continuous optimization of sourcing, production, transportation, and inventory management. Costs of certain components or services may also increase suddenly due to any number of factors.
International supply chains must comply with varying trade regulations, customs procedures, product standards, and documentation requirements across different jurisdictions.
The current United States administration has implemented - and sometimes repealed or paused - tariffs on goods imported from various countries. You can find an up to date list of tariffs, along with pauses and repeals, here.
Changing the rules of the game - and sometimes changing them again - creates an exceptionally volatile environment for supply chain leaders and brings some specific challenges:
- Difficulty planning ahead: Tariffs have been imposed, modified, or paused with little warning, making strategic planning exceptionally difficult. Companies must constantly monitor policy changes and assess potential impacts. They must also look at where they can pivot quickly if need be - if, indeed, it is possible for their particular business. In some complex supply chains it can take years to make big changes.
- Managing retaliatory tariffs: The supply chain tariff challenge extends beyond trade policy imposed by the United States. Countries where companies manufacture or source materials may impose their own retaliatory tariffs, causing further cost fluctuations and complications. China’s retaliatory tariffs are of course a major example of this, and one that is particularly disruptive for many businesses.
- Logistical challenges: New tariffs and regulations can create congestion at certain ports or along specific shipping routes, or cause shipping routes to change quickly as companies scramble to adjust their supply flows, leading to delays and increased transportation costs. For example, a plan to impose high fees on Chinese ships visiting US ports could drastically modify certain shipping routes.
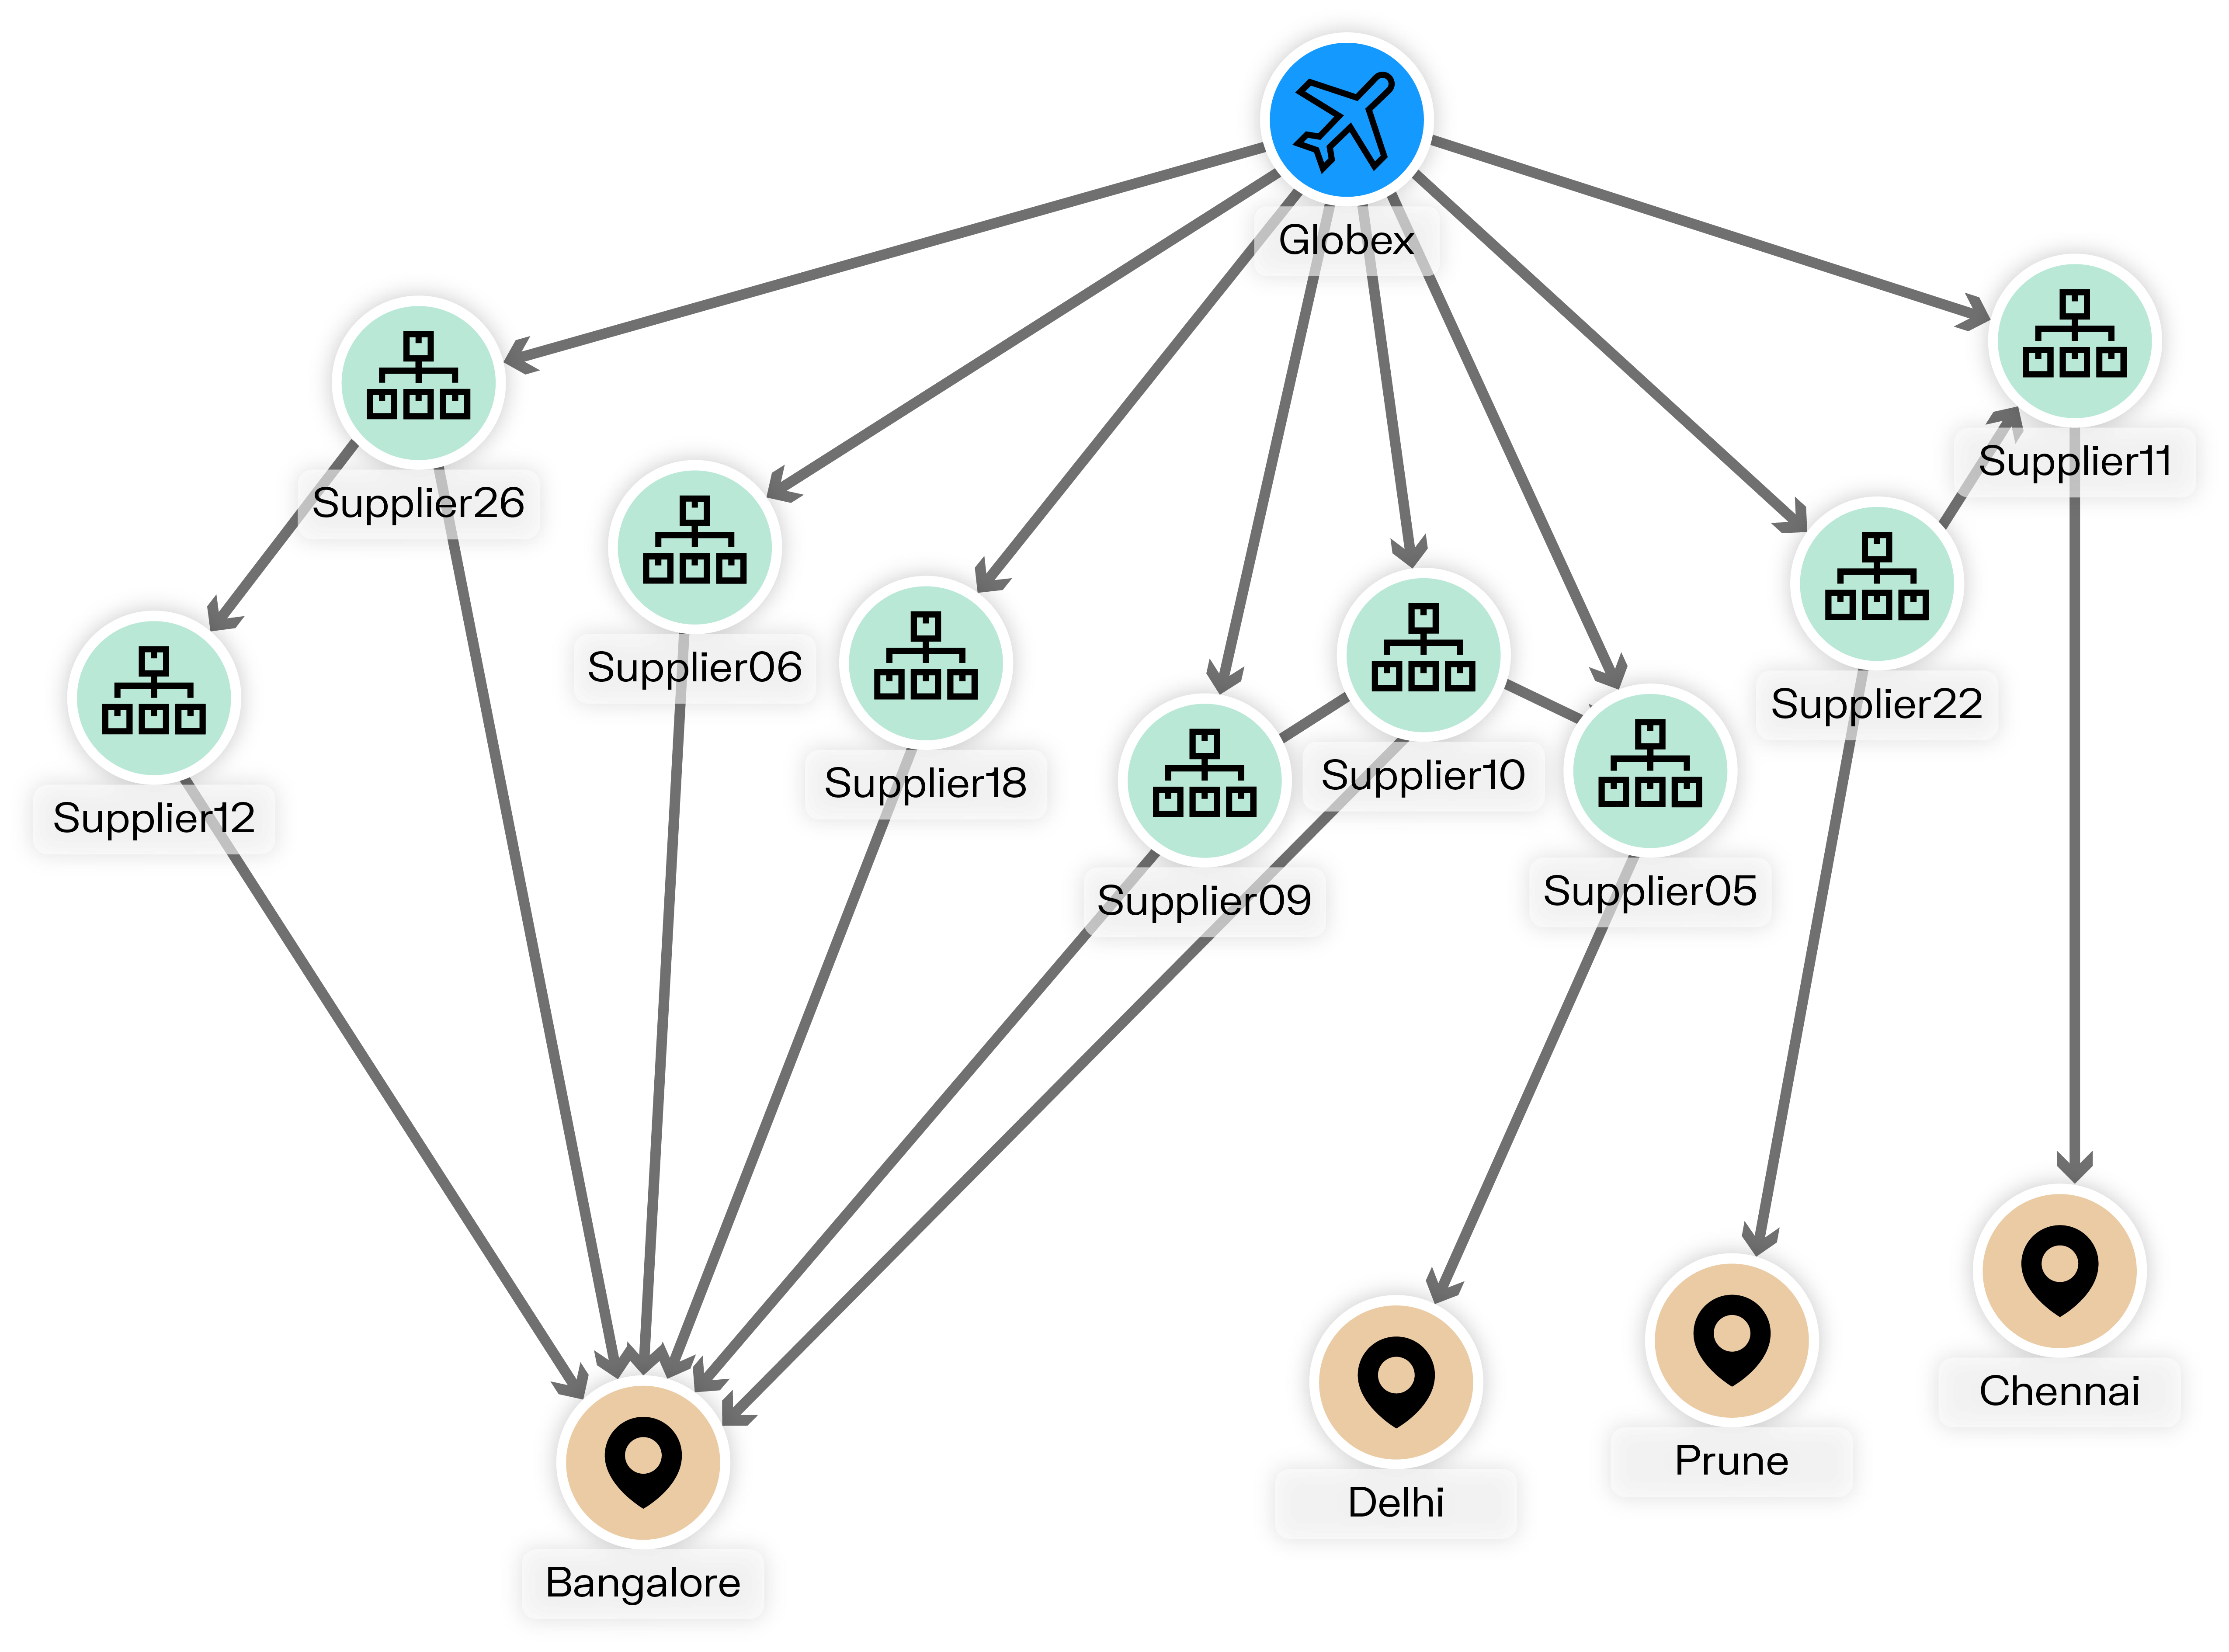
Graph technology offers an effective approach for understanding and managing interconnected data that characterizes supply chains.
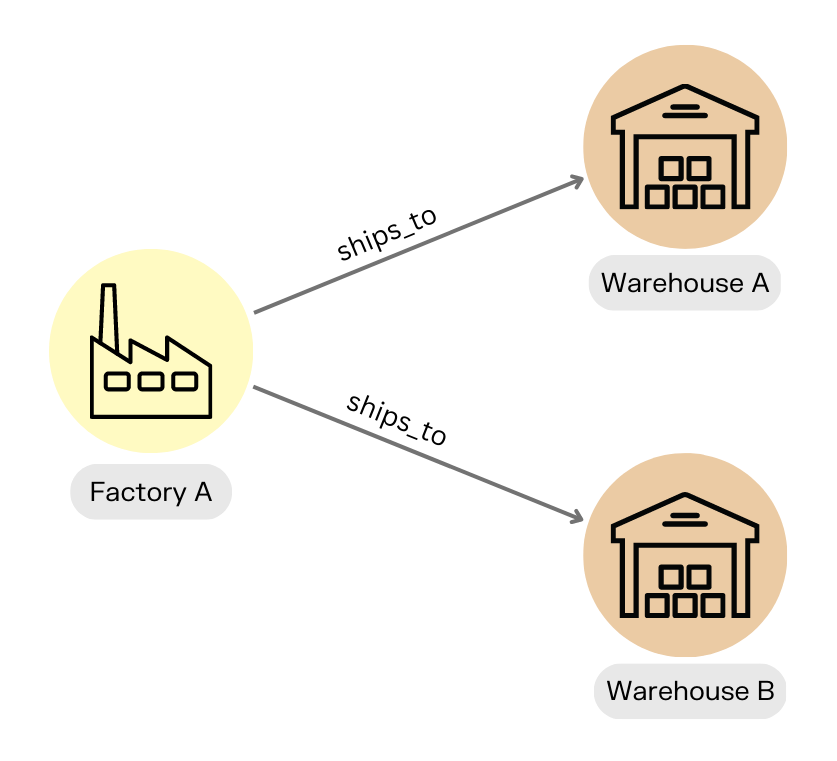
A graph data model organizes information as:
- Nodes: Individual data points representing entities like suppliers, warehouses, or products
- Edges: Connections between nodes showing relationships, dependencies, or flows
Unlike traditional approaches that struggle with complex relationships, graph technology is specifically designed to store, process, and analyze interconnected data. This makes it particularly suitable for supply chain management, where understanding relationships is critical.
Graph technology allows organizations to easily unify and connect data from multiple sources, eliminating data silos that create blind spots and revealing complex relationships structures. By analyzing data as a graph, it’s possible to determine the closeness of different entities, as well as how entities are connected. Graph analytics provides algorithms that help data-driven analysts answer questions or make predictions.
When enhanced with visualization capabilities, graphs provide both comprehensive overviews and the ability to examine specific segments in detail.
These features of graph technology help address many of the major challenges of supply chain management, delivering better transparency, cost optimization, and more. Learn more about managing supply chains with graph in our comprehensive article.

While graph analytics and visualization cannot eliminate the challenges tariffs pose for the supply chain, it significantly improves agility and adaptability when facing uncertainty. Here's a snapshot of just some of the areas where using a graph-based solution can help supply chain managers anticipate change and devise contingency plans for a range of scenarios.
Supply chain knowledge graphs enable complex queries and predictive modeling. With this capability, analysts can:
- Simulate various tariff scenarios using real data
- Identify alternative shipping routes if and when certain paths become cost-prohibitive
- Calculating the financial impact of changing suppliers to assess whether shifting production to locations with lower tariffs would be cost-effective
- Model multi-tier impacts of tariff changes throughout the supply network
Graph technology excels at identifying vulnerabilities within supply chain networks, allowing organizations to build resilience against tariff disruptions. Supply chain managers can use graph to perform several types of analyses to this end.
- Risk propagation modeling: By mapping the interconnections between suppliers, facilities, and distribution channels, graph technology helps predict how tariff impacts might cascade through the network. Companies can visualize which products and business lines face the greatest exposure.
- Resilience scoring: Analysts can develop resilience metrics for different segments of their network based on factors like supplier diversification, geographic distribution, and contract flexibility. Graph visualization makes these metrics intuitive and actionable.
- Scenario testing: Before committing to major supply chain restructuring in response to tariffs, companies can model various configurations within the graph to assess trade-offs between cost, risk, and performance. This allows for more confident decision-making in uncertain times.
As tariffs and trade regulations change, maintaining compliance can become increasingly important - and complex:
- Graph visualization helps trace material origins to ensure regulatory compliance
- Companies can quickly identify which products contain components from countries affected by new tariffs
- Documentation and proof of origin can be linked directly within the graph structure
Tariffs affect not only direct operations but also consumer behavior and market dynamics as consumers anticipate or react to price fluctuations. Graph technology excels at integrating diverse data sources, creating more accurate demand forecasts. It can assist with several aspects of demand forecasting:
- Historical sales data, seasonality patterns, and external events like tariff changes can be incorporated into a single analytical model
- Companies can better predict how price changes resulting from tariffs might impact consumer demand
- Supply chain managers can adjust inventory levels and production schedules accordingly
Consider an electronics manufacturer that sources components from multiple countries. When new tariffs are announced on certain Chinese-made electronic components, for example, the company needs to quickly understand the impact and explore alternatives.
Using a graph-based supply chain management system, they might take actions like:
- Impact assessment: The system instantly identifies all products containing affected components and calculates the tariff's financial impact.
- Alternative sourcing: The graph highlights qualified alternative suppliers in countries not subject to the new tariffs, showing their production capacity and lead times.
- Cost analysis: The system models the total cost comparison between paying the tariff versus switching suppliers, including transition costs.
- Risk evaluation: The graph reveals potential second-order effects, such as capacity constraints at alternative suppliers or transportation bottlenecks.
This comprehensive analysis, difficult to achieve with traditional systems, allows for informed decision-making in days rather than weeks.
As tariff volatility becomes a persistent feature of global trade, supply chain managers need tools that meet these new and evolving challenges. Graph technology's ability to model complex relationships, simulate scenarios, and provide clear visualizations makes it particularly valuable in this environment.
By implementing graph-based solutions, such as Linkurious’s graph-powered decision intelligence platform, companies gain the agility to respond quickly to changing tariff conditions while maintaining visibility across their entire supply network. The result is not just better risk management but also the ability to identify new opportunities amid changing trade conditions.
A spotlight on graph technology directly in your inbox.