Data scoring: Integrating quantitative insights into your business workflows with graph
Data scoring transforms raw information into actionable insights through numerical evaluation. Organizations use scoring methods to quantify complex factors, enabling better decision-making and predictions. This article takes a look at data scoring concepts, applications across industries, and key techniques data professionals can implement.
It also looks at how the data pre-processing step in Linkurious Enterprise makes it easy to use graph data science to integrate context-based scoring into business workflows.
Data scoring is the process of assigning numerical values to entities based on specific attributes or behaviors. A score is computed to measure or assess something, typically represented as a numerical value that can be normalized between 0 and 1.
The data scoring process uses a mathematical formula that computes a score for a given entity. This formula accounts for relevant variables, applies appropriate weights, and produces a final value that represents the entity's standing according to defined criteria.
It's important to note that a score is not a classification or a way to group entities with no particular ordering. Unlike categorization, scoring creates a spectrum or ranking that allows for precise comparisons and prioritization.
Data scoring is used across industries and for various applications, including performance evaluation, comparison, decision making, and prediction. These numerical assessments help organizations allocate resources efficiently and identify opportunities or risks.
Here are some examples of specific data scoring use cases:
Marketing and sales teams use lead scoring to evaluate potential customers based on their likelihood to convert. Factors may typically include demographic information, online behavior, engagement with marketing materials, and company size and industry.
Lead scoring helps prioritize sales efforts by focusing on prospects with higher conversion potential.
CLV scoring calculates the total expected revenue from a customer throughout their relationship with a company. The factors used to calculate a CLV score include purchase frequency, average order value, customer retention probability, and acquisition costs.
This score helps businesses identify their most valuable customers and tailor retention strategies.
Predictive scoring estimates future outcomes based on historical data patterns. Applications include sales forecasting, equipment failure prediction, customer behavior anticipation, and market trend analysis.
These scores help organizations prepare for likely scenarios and adjust strategies accordingly.
Risk scoring is one of the most common - and essential - types of scoring used by organizations. Financial institutions, insurance companies, and security firms, for example, use risk scoring to assess potential threats or liabilities. These scores evaluate many different elements, which may include: past incidents, behavioral patterns, environmental factors, and vulnerability indicators.
Risk scoring enables proactive mitigation strategies before problems occur. To give just a few examples, some common types of risk scoring include:
Financial services use credit scoring to assess borrower reliability. They help these organizations to determine loan approvals, interest rates, and credit limits for both individuals and businesses. Several elements factor into the calculation of a credit score, including:
- Payment history
- Debt levels
- Credit history length
- Types of credit used
- New credit applications
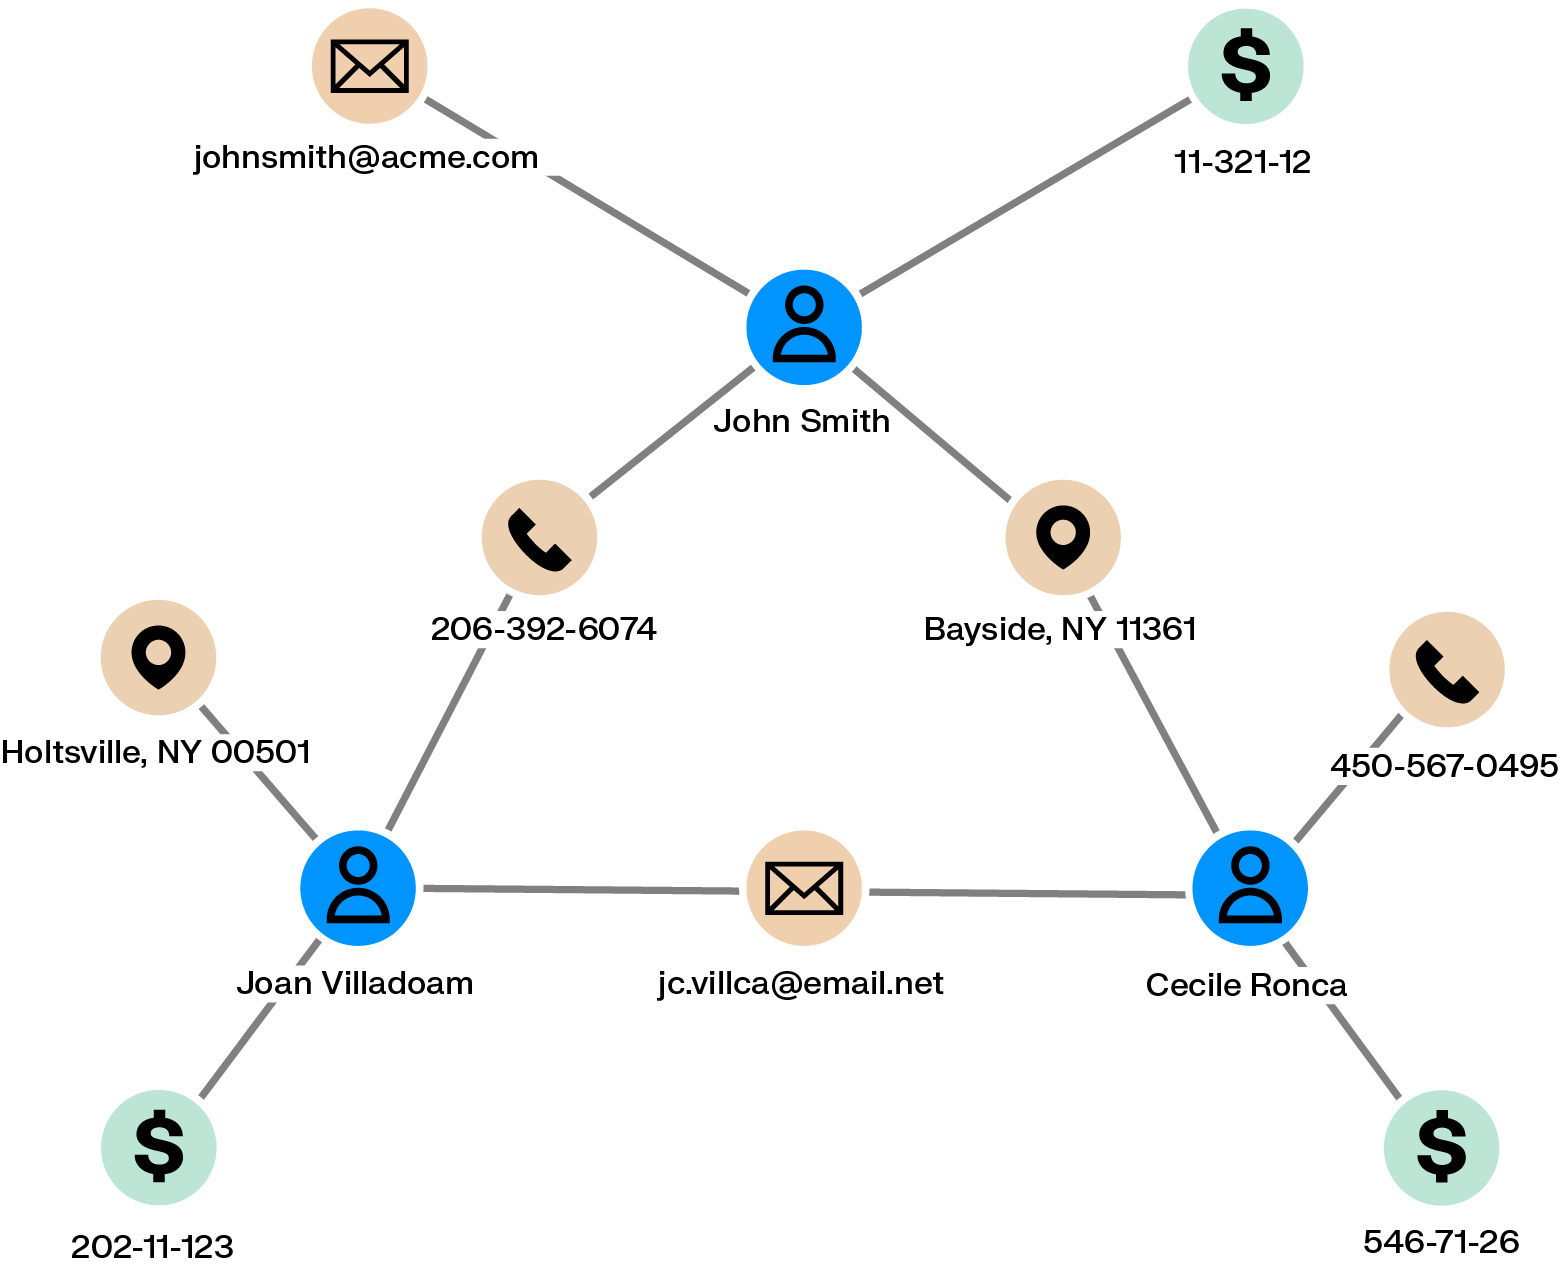
Graph data science specializes in analyzing connected data, where relationships between entities provide crucial context for scoring models. Unlike traditional data analysis that treats data points as independent, graph data science examines how entities influence each other through their connections.
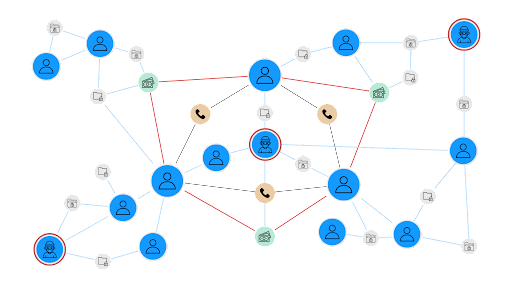
Graph data models represent entities (nodes) and their relationships (edges) in an interconnected network structure. This approach offers distinct advantages for data scoring applications:
- Connection patterns reveal dependencies that impact risk profiles
- Relationship strength indicates influence levels between entities
- Network position highlights strategic importance beyond individual attributes
- Propagation effects show how changes in one entity impact connected entities
These relationship insights enable more sophisticated scoring systems that account for both direct attributes and network context.
Graph analytics provides techniques for scoring entities based on their network properties:
- Financial institutions use graph scoring to detect fraud rings by identifying unusual connection patterns between accounts, addresses, and phone numbers
- Telecommunications companies score network nodes to optimize infrastructure investments based on traffic flow and centrality
- Supply chain managers calculate resilience scores by analyzing vulnerability points in supplier networks
By incorporating relationship data, graph-based scoring detects patterns that would remain hidden in traditional scoring methods. This approach is particularly valuable when connections between entities significantly influence their behavior or importance.
The data pre-processing feature in Linkurious Enterprise opens up the possibility of using graph analytics to enrich your data - including performing network-based data scoring. Those scores can then be used in alerting for more efficient data investigation and exploration.
Data pre-processing is a specific step in alerts within Linkurious, where you can execute graph queries and write the result to the graph within the configuration panel. Data pre-processing lets you go from graph query to an ongoing and automated data enhancement process in just minutes.
This feature helps reduce the friction to using graph analytics to generate different types of scores for entities in your data directly within Linkurious Enterprise.
There are many ways you can put data pre-processing into practice. One powerful use case is using your connected data to perform scoring. Let’s look at an example of how to perform network-based risk scoring for a supply chain use case.
Here, you have a supply chain dataset where companies are connected to suppliers, locations, and risks. You might want to identify all the risks each company is indirectly connected to and use that information to create an aggregate risk score. This allows you to switch from an entity-centric view of risk to a network-based view of risk that takes indirect risks into account.
Here’s what the query would look like:
//Description: identifies for each company the climate risks it's connected to and aggregate those risks into a single score
MATCH (a:Company)-[:HAS_SUPPLIER*1..5]->(:Supplier)-[HAS_SITE]->(:Site)-[:HAS_LOCATION]->(l:Location)

WITH DISTINCT a, l
OPTIONAL MATCH (l)-[:HAS_RISK]->(cr:ClimateRisk)

WITH a, reduce(totalRisk = 0, n IN collect(distinct (cr)) | totalRisk + n.current_risk) AS aggregated_risk
SET a.aggregated_risk = aggregated_risk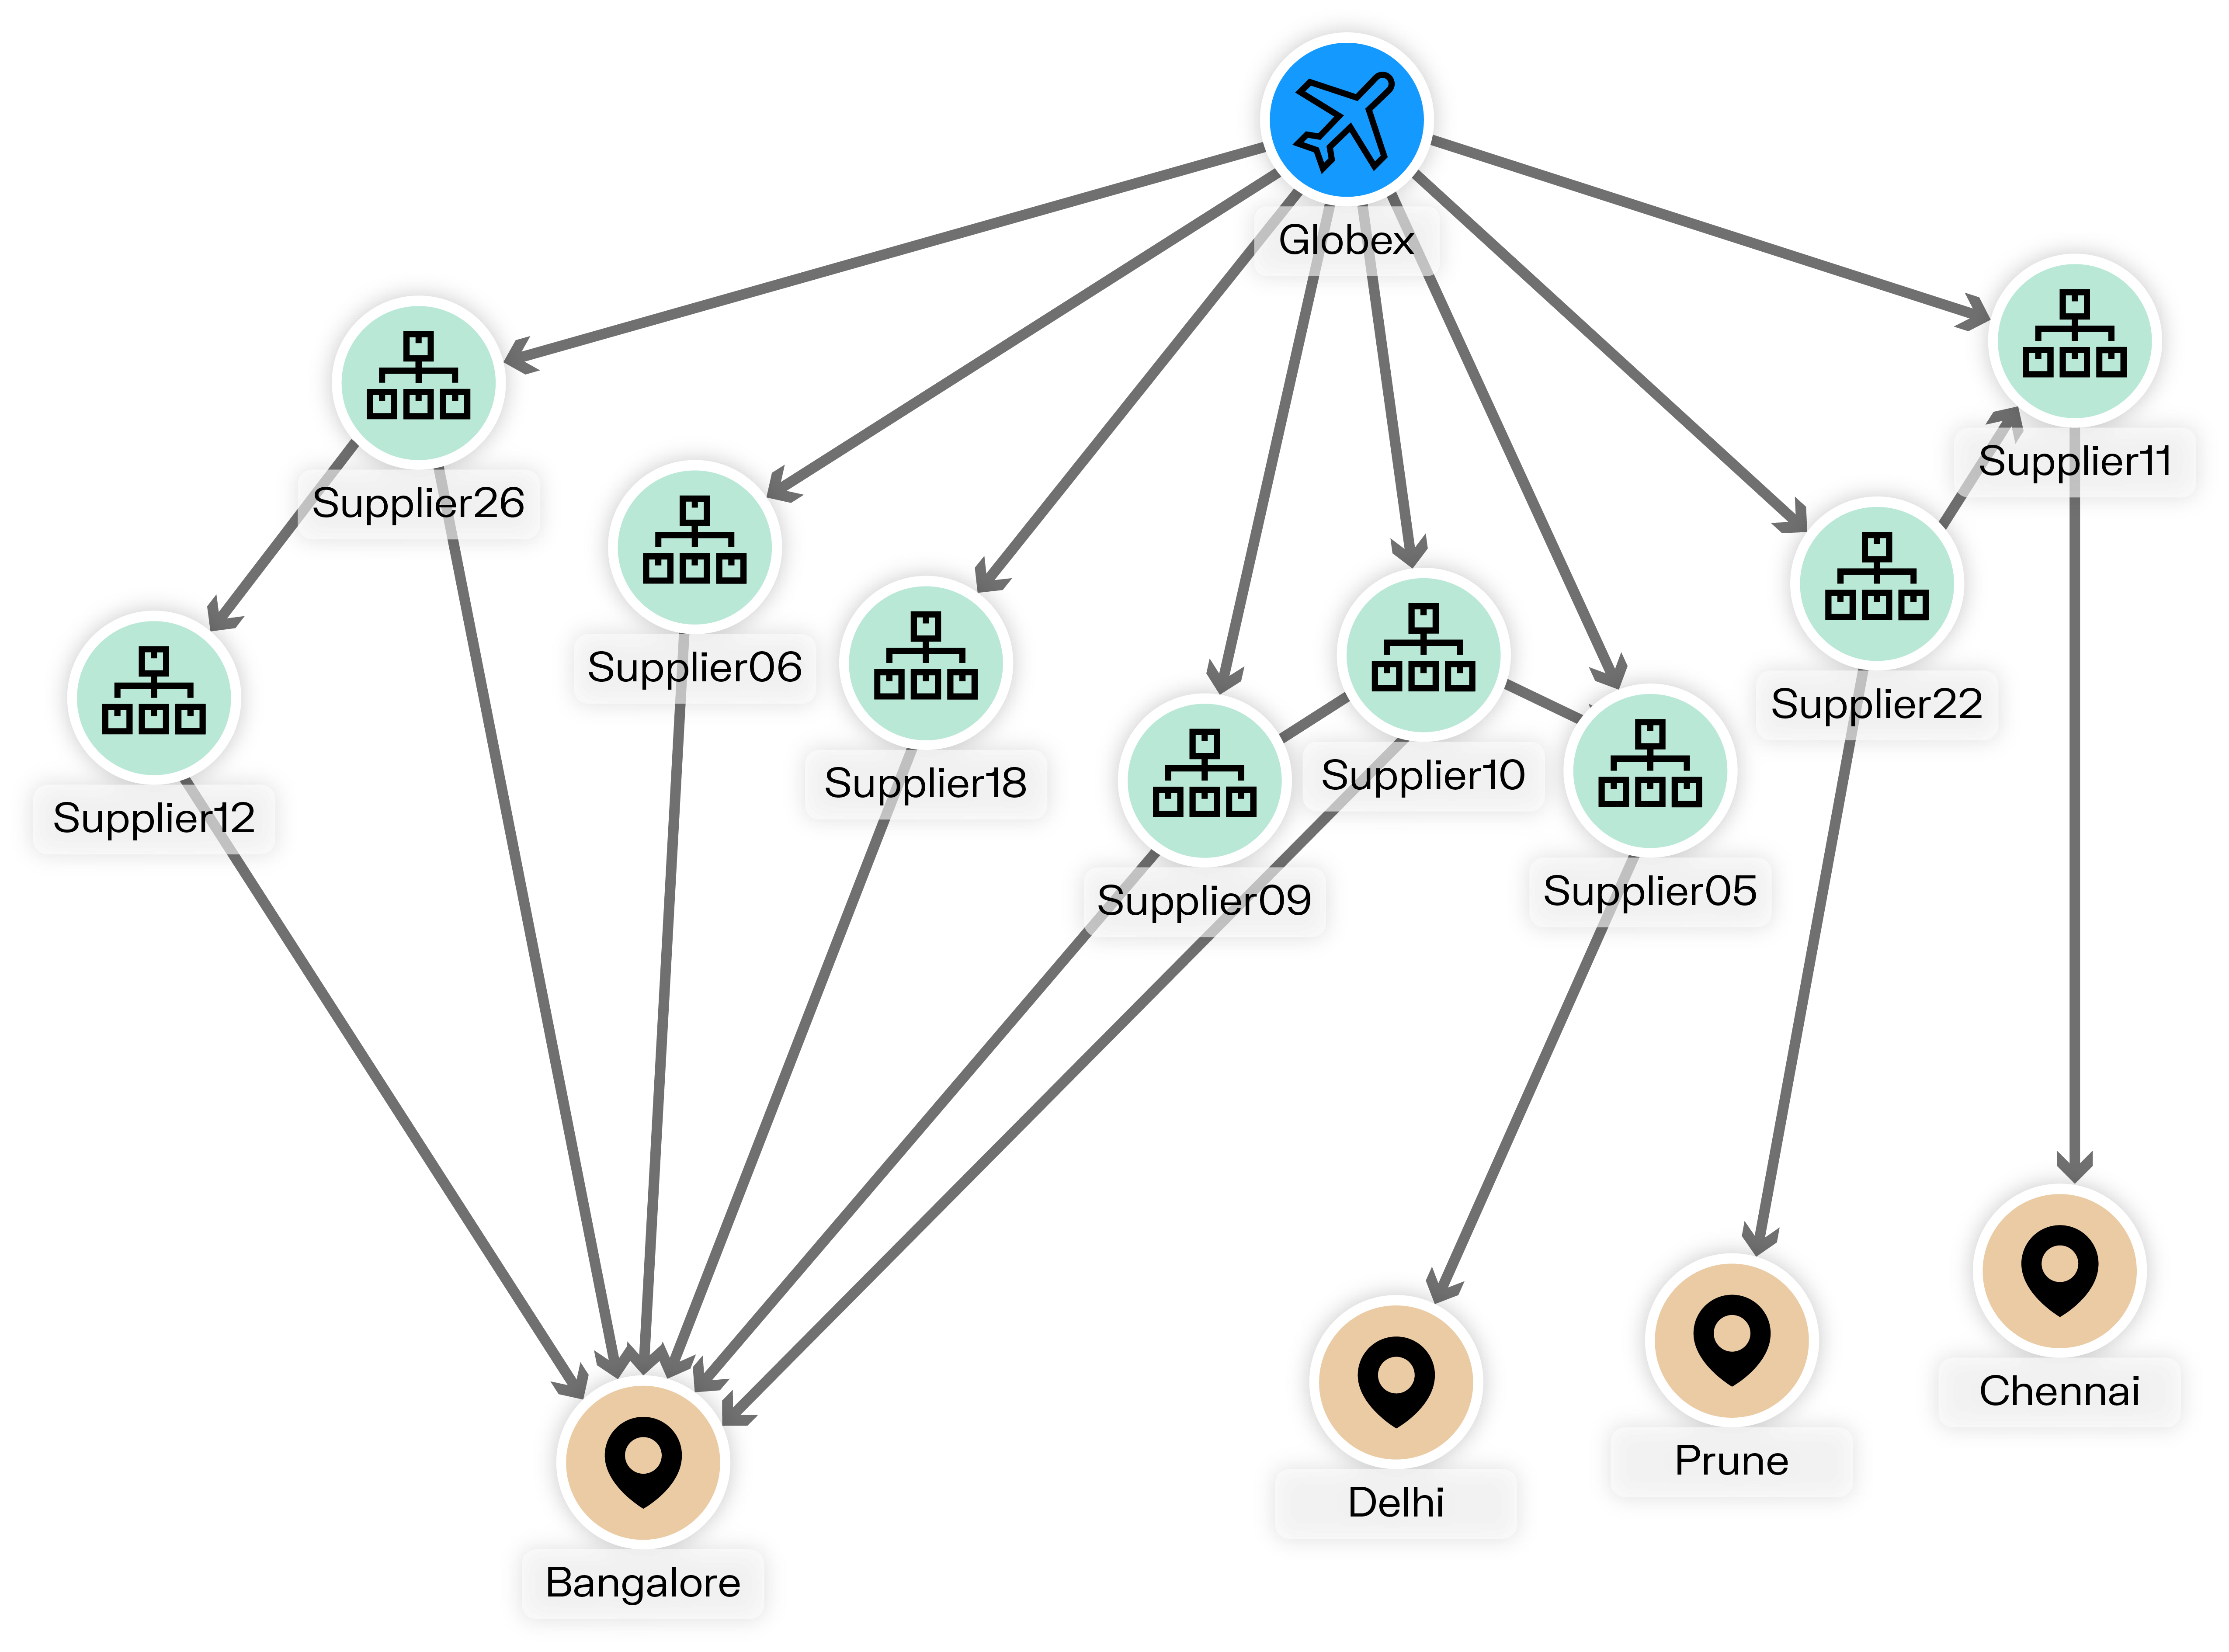
You can also use data pre-processing to compute a network-based risk indicator, which you can then combine with an entity-level risk score to create a hybrid risk score.
This kind of risk indicator can be used within a third-party system. You could, for example, use “number of indirect connections to fraudsters” as a feature for a machine learning model.
Data pre-processing brings the power of context-based data scoring to your graph analysis and investigation, bringing your more context, faster.
To learn more about the ins and outs of data pre-processing in Linkurious Enterprise, or to learn how you can get started on graph investigation, get in touch today.
A spotlight on graph technology directly in your inbox.