The question for most organizations today isn’t about whether to use artificial intelligence (AI) and machine learning (ML), but how to use these technologies. They have broad applications across industries, which have only grown with the widespread accessibility of generative AI.
In this article, though, we’re going to take a closer look at machine learning specifically, which can be all the more powerful when paired with other types of technology. Graph technology, a type of analytics that thrives on connected data, can be naturally combined with machine learning in a complementary approach. Graph machine learning has the potential to be transformational for many organizations, bringing improved efficiency and lower costs.
This article gives a brief introduction to graph analytics, then looks at how graph machine learning models can enhance artificial intelligence and machine learning, with a recommendation engine use case as an example of graph machine learning in action.
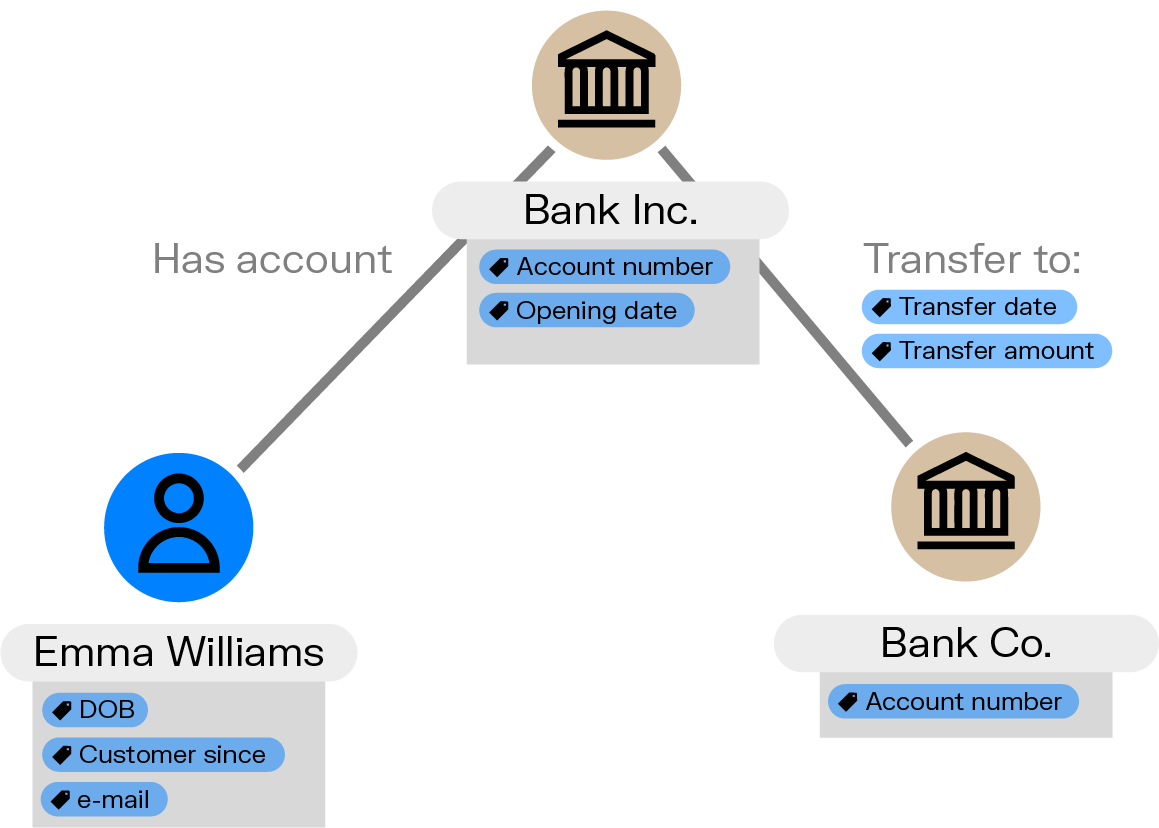
Let’s start with the basics of what graph analytics is. Graph is built to work on connected data. The essential components of a graph data model are nodes, edges, and properties:
- Nodes (also called vertices) represent individual data points such as people, places, phone numbers, etc.
- Edges or relationships are how two nodes are connected, for example a person has a bank account.
- Properties are the attributes of nodes or relationships. A person might be associated with a date of birth, for instance.
Graphs can be used to represent all kinds of networks: social networks, networks of fraudsters, IT infrastructure networks, etc. Because graphs are built on the idea of connections and links, they are a good choice for integrating data from across sources.
Graph machine learning applies machine learning algorithms to graph-structured data for predictive and analytical tasks. By learning from both the attributes of individual nodes and the structure of their connections, these algorithms can uncover patterns and relationships that would be invisible in traditional tabular data.
Common tasks include link prediction, node classification, identifying clusters or communities within networks, and forecasting how graphs will evolve over time.
Graph machine learning extends both graph analytics and machine learning, learning from both the interconnected structure of graph and ML features. This makes it valuable across domains, from detecting fraud rings in financial networks and powering recommendation systems, to optimizing supply chain operations.
We’ll take a look at graph machine learning, and the different ways both machine learning and graph can work together for more powerful and accurate analytics.
The functionalities of graph and machine learning complement each other. Machine learning combines statistical and analytical techniques to classify information and spot patterns within data. It can go beyond static rules in doing so, and scale human insights, turning them into algorithms.
Graph is used to detect complex patterns and provide visual context to analysis. Graph data can be ingested into machine learning algorithms, and then be used to perform classification, clustering, regression, etc. Together, graph and machine learning provide greater analytical accuracy and faster insights.
Graph analytics strengthens machine learning by adding structural context that traditional data formats can’t capture. Graph algorithms surface both direct and indirect relationships that can significantly improve model performance. Metrics such as PageRank, betweenness centrality, or community membership can be used as additional features in a machine learning model, helping it better understand the role each entity plays within a broader network.
By incorporating graph-derived features, machine learning can detect complex patterns that might otherwise remain hidden. These insights often translate into more accurate classification, clustering, or regression results. Graph context also improves explainability: visualizing connections helps clarify why a model made a particular prediction, such as flagging a customer as high risk or detecting an unusual transaction pattern.
Machine learning can also enrich and strengthen graph analytics. ML models can automate tasks such as entity resolution, helping unify data from multiple sources into a single, coherent graph. This creates a more complete view of the relationships within a dataset.
Machine learning predictions, such as risk scores, classifications, or similarity measures, can be written back into the graph as new properties. Once stored in the graph, these insights can be visualized, explored, or used as inputs for further graph analysis. Analysts can then investigate anomalies or alerts directly within a graph visualization tool, and their feedback can be captured to refine future predictions. This creates a continuous loop where both automated intelligence and human expertise contribute to improving the graph and the underlying models.
Now, it’s time to get more practical. We’ll look at a couple of different ways you can combine graph and machine learning, using either a hybrid architecture or a unified architecture.
A hybrid architecture combining graph and machine learning is great for organizations with existing ML pipelines. It also lets you perform feature engineering via graph algorithms and feed graph-derived features back into ML models.
A simple architecture mixing machine learning and graph analytics might look like the following. It starts with the data you already have, maybe in legacy systems such as relational databases. That data then flows into an AI platform, such as Dataiku. There it is cleaned and enriched.
That data can then be stored in a graph database such as Neo4j. Such a database can also run graph analytics. For example, the graph database and the Graph Data Science Platform can be used to compute generic graph metrics (e.g. betweenness centrality, PageRank score), domain-specific graph metrics (e.g. the number of known fraudsters a given client is indirectly connected to) or even graph embeddings (which translate graph data into a machine learning friendly format).
This data can be looped back in the AI platform as extra features. Here it can be used with the other data points to train a machine learning model and make the model more efficient. The machine learning model can enrich the graph with extra properties such as a risk score.
All of this information can be made readily available to end users through a graph visualization tool such as Linkurious Enterprise. Specifically, the risk score computed in the AI platform can be used to generate alerts in the Linkurious Enterprise case management system. Such alerts can be visually investigated by analysts to eventually confirm or dismiss them. These human insights can also be captured via the Linkurious Enterprise API, providing a feedback mechanism to the machine learning algorithm.

As an alternative to integrating your data science platform with your graph analytics stack, it’s also possible to run your graph analytics and machine learning workloads in a single integrated environment. This type of architecture is ideal for end-to-end graph-native analytics. It can be used for link prediction, node classification, similarity, etc., and can reduce tooling complexity.
You can do this using a tool such as the Neo4j Graph Data Science library, which includes machine learning capabilities. This type of tool can be used to predict links and classify nodes.
The first step is to load your data into your graph database. You can then use the data science library to train a machine learning model with your graph data. The model can then be used to make predictions. In a fraud detection use case, those predictions might include whether two persons are likely to know each or whether a node is likely to be similar to other nodes representing known fraudsters.
Just like in the previous example, this information can be made readily available in a graph visualization tool like Linkurious Enterprise. For instance, the likelihood that a given node is indeed similar to existing “fraud” nodes can be used to generate alerts in the Linkurious Enterprise case management system, which can then be assessed as a graph visualization and confirmed or dismissed.
Analysts can enrich the graph with extra information by flagging a transaction or individual as suspicious or specifying what type of risk it is related to (terrorism funding, trade-based money laundering, etc).
As these human insights are stored in the graph database, they can immediately be leveraged by machine learning, helping close the loop between the machine learning algorithm and human intelligence.
Recommendation engines are tools to help users find relevant information among many different options. In a world with increasing choices, recommendation engines are essential features of e-commerce platforms, social networking sites, media platforms, and more. But recommendation is challenging, since people tend to have diverse and varied interests and tastes.
Graph machine learning can help more easily tackle the problem of building a recommendation engine.
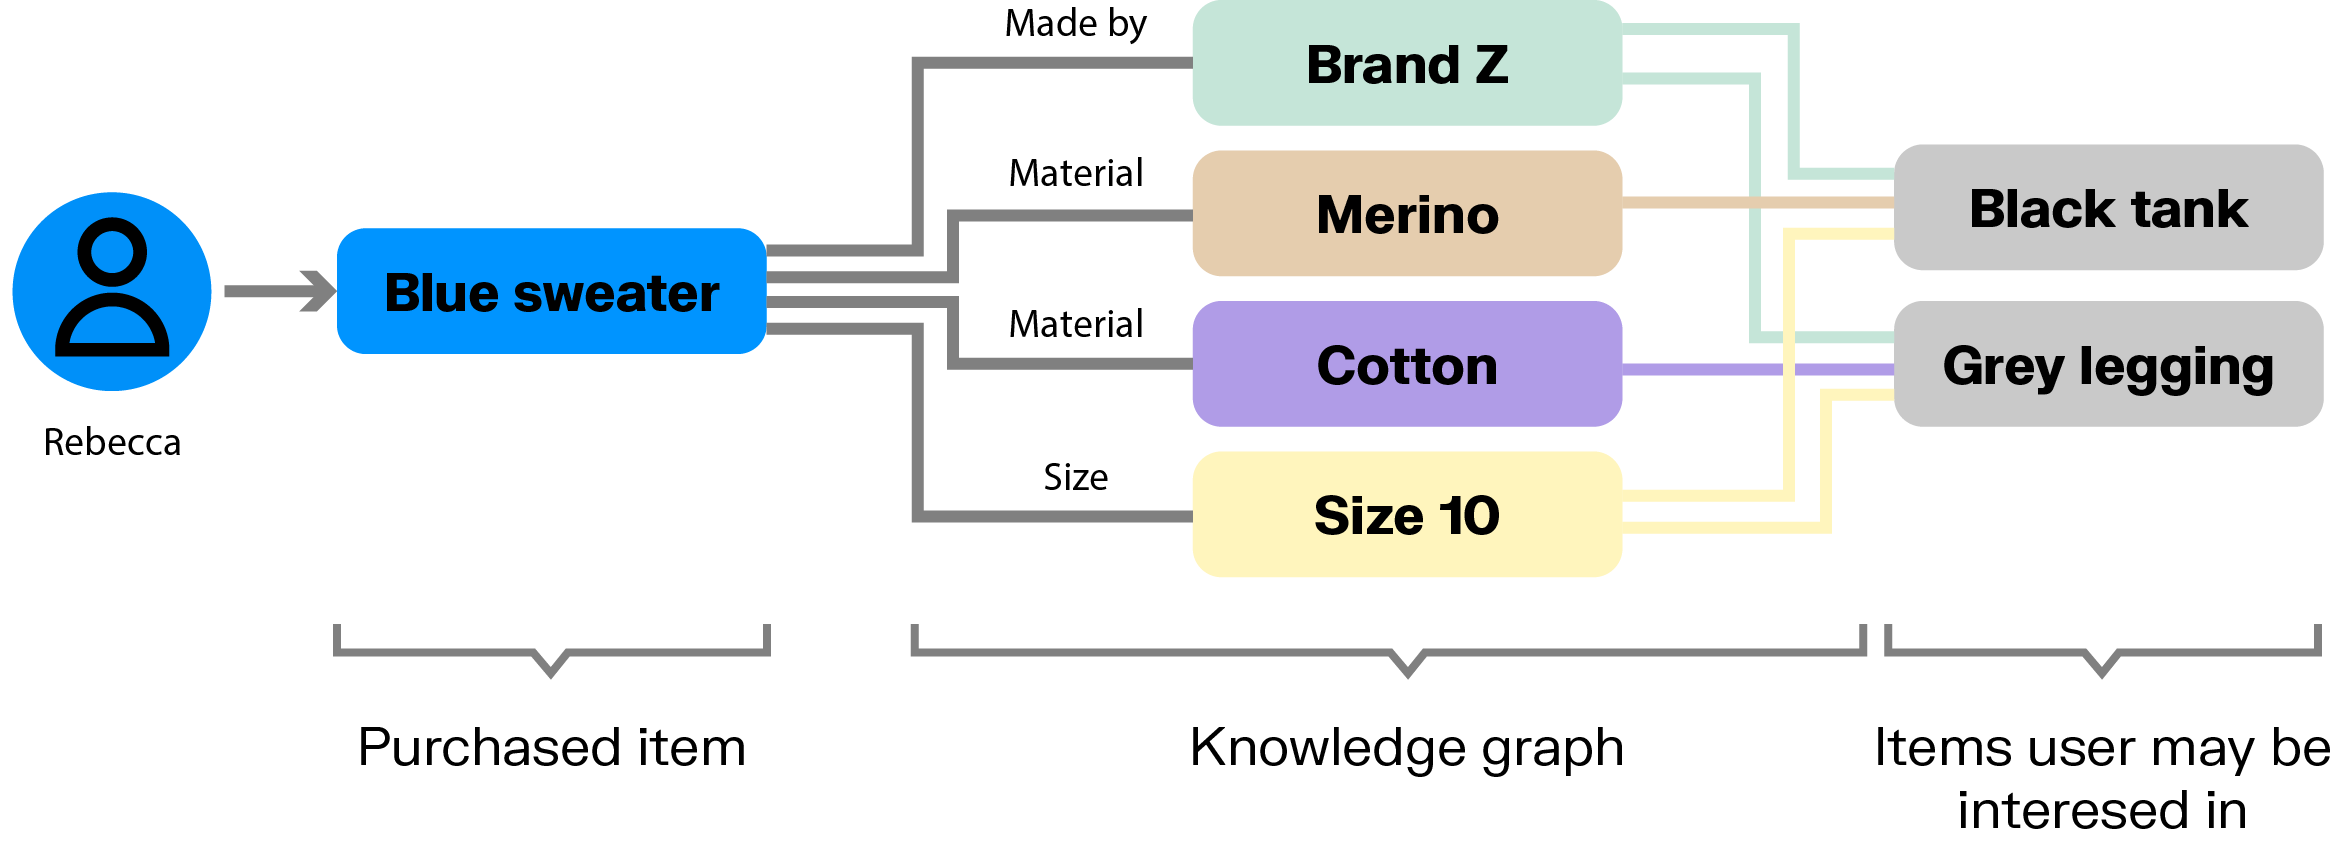
To start out, you’d need to gather data around user features and around product features in the case of an e-commerce recommendation engine. Next, you’d build the graph where each feature is a node, and each interaction is an edge. For example, a customer we’ll call Rebecca might have clicked on items 2, 5, and 15, and purchased item 5. Based on these past interactions, you want to recommend new products to customers.
One option is to use knowledge graphs containing all kinds of information about a product. If we’re talking about clothing, that might include the brand, the size, the style, the color, etc.
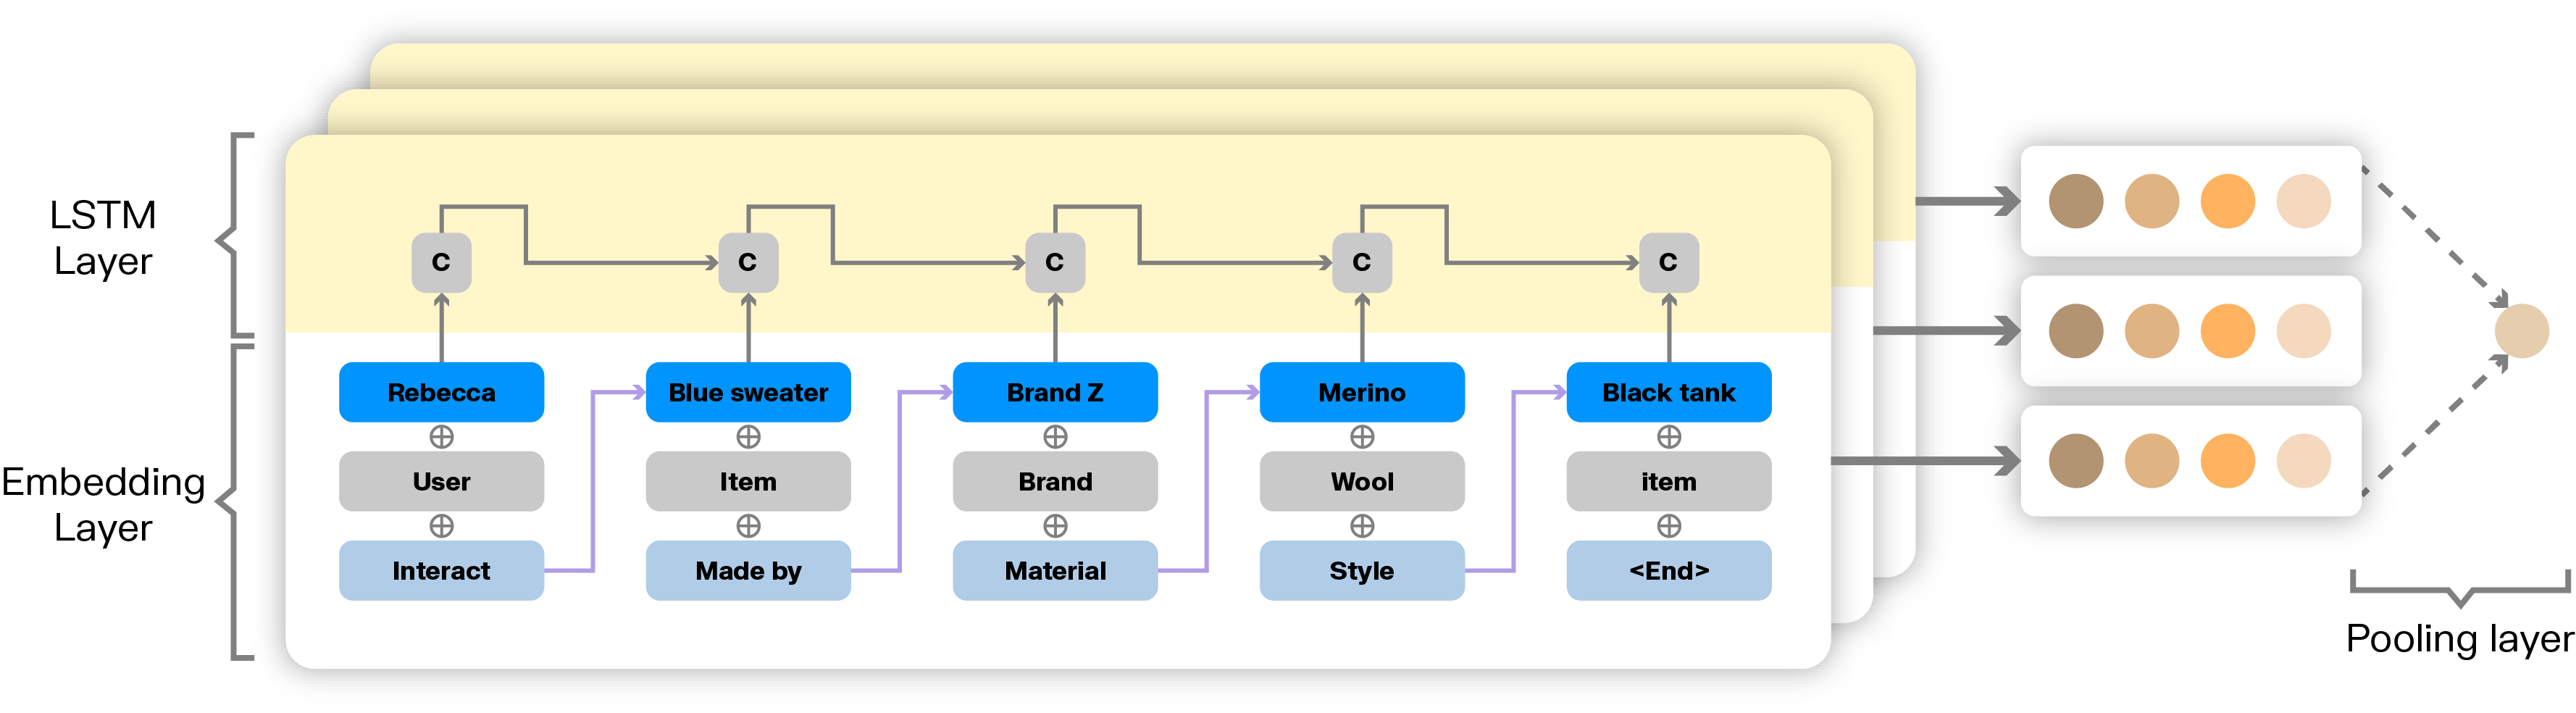
Through an embedding layer, you can understand the path a customer takes to arrive at one product of interest from another - what the path is that takes them there. A long short-term memory (LSTM) neural network layer on top of that can then embed, learn, and generate probabilities for the paths for each item for sale.
Linkurious is a software company providing technical and non technical users alike with the next generation of detection and investigation solutions powered by graph technology. Simply powerful and powerfully simple, Linkurious Enterprise helps more than 3000 data-driven analysts or investigators globally in Global 2000 companies, governmental agencies, and non-profit organizations to swiftly and accurately find insights otherwise hidden in complex connected data so they can make more informed decisions, faster.