Cybersecurity threat analysis: Building a digital twin with graph to strengthen your defenses
Opportunities for bad actors to exploit digital systems have greatly increased alongside accelerated digital transformation. The amounts lost to cybersecurity attacks are enormous: the average data breach cost organizations $4.4 million in 2025. And AI is only helping bad actors carry out cyber attacks even faster: an estimated 80% of ransomware attacks use AI to enhance effectiveness.
As cybersecurity threats continue to grow in volume and complexity, analysts must meet the challenge of managing risk and protecting their organizations. The need for deploying effective and efficient security measures has never been higher. To mitigate risks, analyze threats, and gain greater visibility into their IT environments, more organizations are turning to graph technology.
In this article, we’ll look at the particular challenges of doing cybersecurity threat analysis today. We'll also explore how using graph technology to create a digital twin enables security professionals to detect suspicious activity quickly while also providing superior clarity around potential vulnerabilities across all areas of the organization's network infrastructure to ultimately reduce risk.
Cybersecurity threat analysis involves identifying, evaluating, and understanding potential digital security threats. Analysts examine attack patterns, threat actor behaviors, vulnerabilities in systems, and the potential impact of security incidents. The work requires understanding the tactics, techniques, and procedures of hackers to effectively mitigate risks.
Cybersecurity threat analysis requires connecting many dots. Threat intelligence provides context about known adversaries and their tactics. Security data flows in from across the environment: logs, network traffic, endpoint telemetry, and authentication systems. Analysts must link disparate events, recognize patterns that might indicate compromise, and anticipate how attackers might escalate their access. The goal is both reactive and proactive: responding to active threats while identifying weaknesses before they're exploited.
Modern threat analysis deals with non-linear attack sequences. An initial phishing email might trigger credential theft, which enables lateral movement across systems, leading to data exfiltration and eventually ransomware deployment. Each step might appear unrelated when viewed in isolation, making it essential to understand the relationships between entities, actions, and events across time.
Cybersecurity is a field defined by a high level of complexity, requiring analysts to bring together many different pieces of information. By many measures, defenders are at a disadvantage compared with bad actors. The challenges come from the sophistication of cybercriminals themselves, as well as from the limitations of many cybersecurity systems.
The reality on the ground is that compared to cyber attackers, cybersecurity analysts have a tougher job. They need to anticipate every possible attack and spot every vulnerability. Attackers, on the other hand, need only identify a single chink in the armor to break down the defenses and cause harm resulting in financial losses and reputational damage.
The widespread availability of powerful AI tools has only supercharged cybersecurity threats.
There are a multitude of cybersecurity threats and they are constantly evolving. Security analysts therefore need to be constantly vigilant for new attack patterns.
Some common categories of cybersecurity threats are:
- Social engineering. This involves manipulating people into performing some action against their own interests or to the detriment of the organization they work for. It may involve convincing someone to give out sensitive information via email or over the phone by impersonating a colleague or manager, for example. Phishing is the most common type of social engineering, accounting for over half of reported security breaches according to PwC.
- Ransomware. These attacks remove a person or company’s access to their IT systems or data. The attacker will refuse to reinstate access, or may threaten to publish stolen data, if the victim does not pay a ransom. These attacks can result in both financial and reputational damage for the victim, and can have a major societal impact: ransomware attacks on hospitals or healthcare centers, for example, can have serious negative consequences for patients.
- Distributed denial of service (DDoS). Bad actors use hijacked computers that send a large volume of requests to a service, such that it can’t carry out its regular work. The computer systems then no longer function, creating a “denial of service.”
- Risks from third-party vendors. Nearly all companies use third-party vendors so their teams can focus on the core business or services. This can expose organizations to increased cyber risk through those vendors, however.
While organizations can use vulnerability scanners to help find flaws in cyber defenses, these tools have their limitations. One of the most significant is the lack of depth and context that they provide. Vulnerability scanners often only inspect an organization’s external digital attack surface, meaning they can only identify surface-level vulnerabilities.
However, hackers often chain multiple vulnerabilities together to achieve their objective. With only surface-level visibility, an organization may be blind to the second, third, or later links in these chains.
To fully understand the vulnerabilities in a system and to effectively protect an organization, defenders need a full, 360° understanding of IT ecosystems. This is where graph technology can help.
Graph technology provides a natural way to represent connected data - including complex IT infrastructure. A graph data structure consists of:
- Nodes (individual data points), and
- Edges (the connections between those data points).
Together they form an interconnected network of data that makes it easy to spot patterns and anomalies, understand interdependencies, and more.

Graph databases, where graph data is stored, are a good fit to reinforce your cybersecurity arsenal since they can integrate many data sources and incorporate large data volumes. Given that many organizations have vast IT systems, it’s essential to be able to de-silo data related to them.
By bringing everything together into one system, connecting the dots between various signals, and gaining contextual information around those signals, it becomes easier to proactively spot suspicious patterns of behavior or weaknesses in defenses. It also simplifies complex post-attack forensic analysis, which can involve bringing together vast amounts of data to understand the what and the how of the attack in order to take strong preventative measures for future security.
And, by applying a graph visualization solution on top of your database, tracking down patterns and anomalies becomes intuitive, and sharing reports and findings is much easier.
There are many ways to apply graph technology to cybersecurity threat analysis and risk management (check out our white paper for more on the topic). We’re going to take a look at one technique that some organizations use: building a digital twin knowledge graph of a part of—or your entire—IT and security ecosystem. A digital twin can be queried by cybersecurity analysts to locate weak points, identify key risks and dependencies, and perform impact analysis in case of an attack. It can also be used to build detection models for malicious activities.
The data you bring into your digital twin may include:
- Connected devices
- User access events
- Application resources usage
- Service health
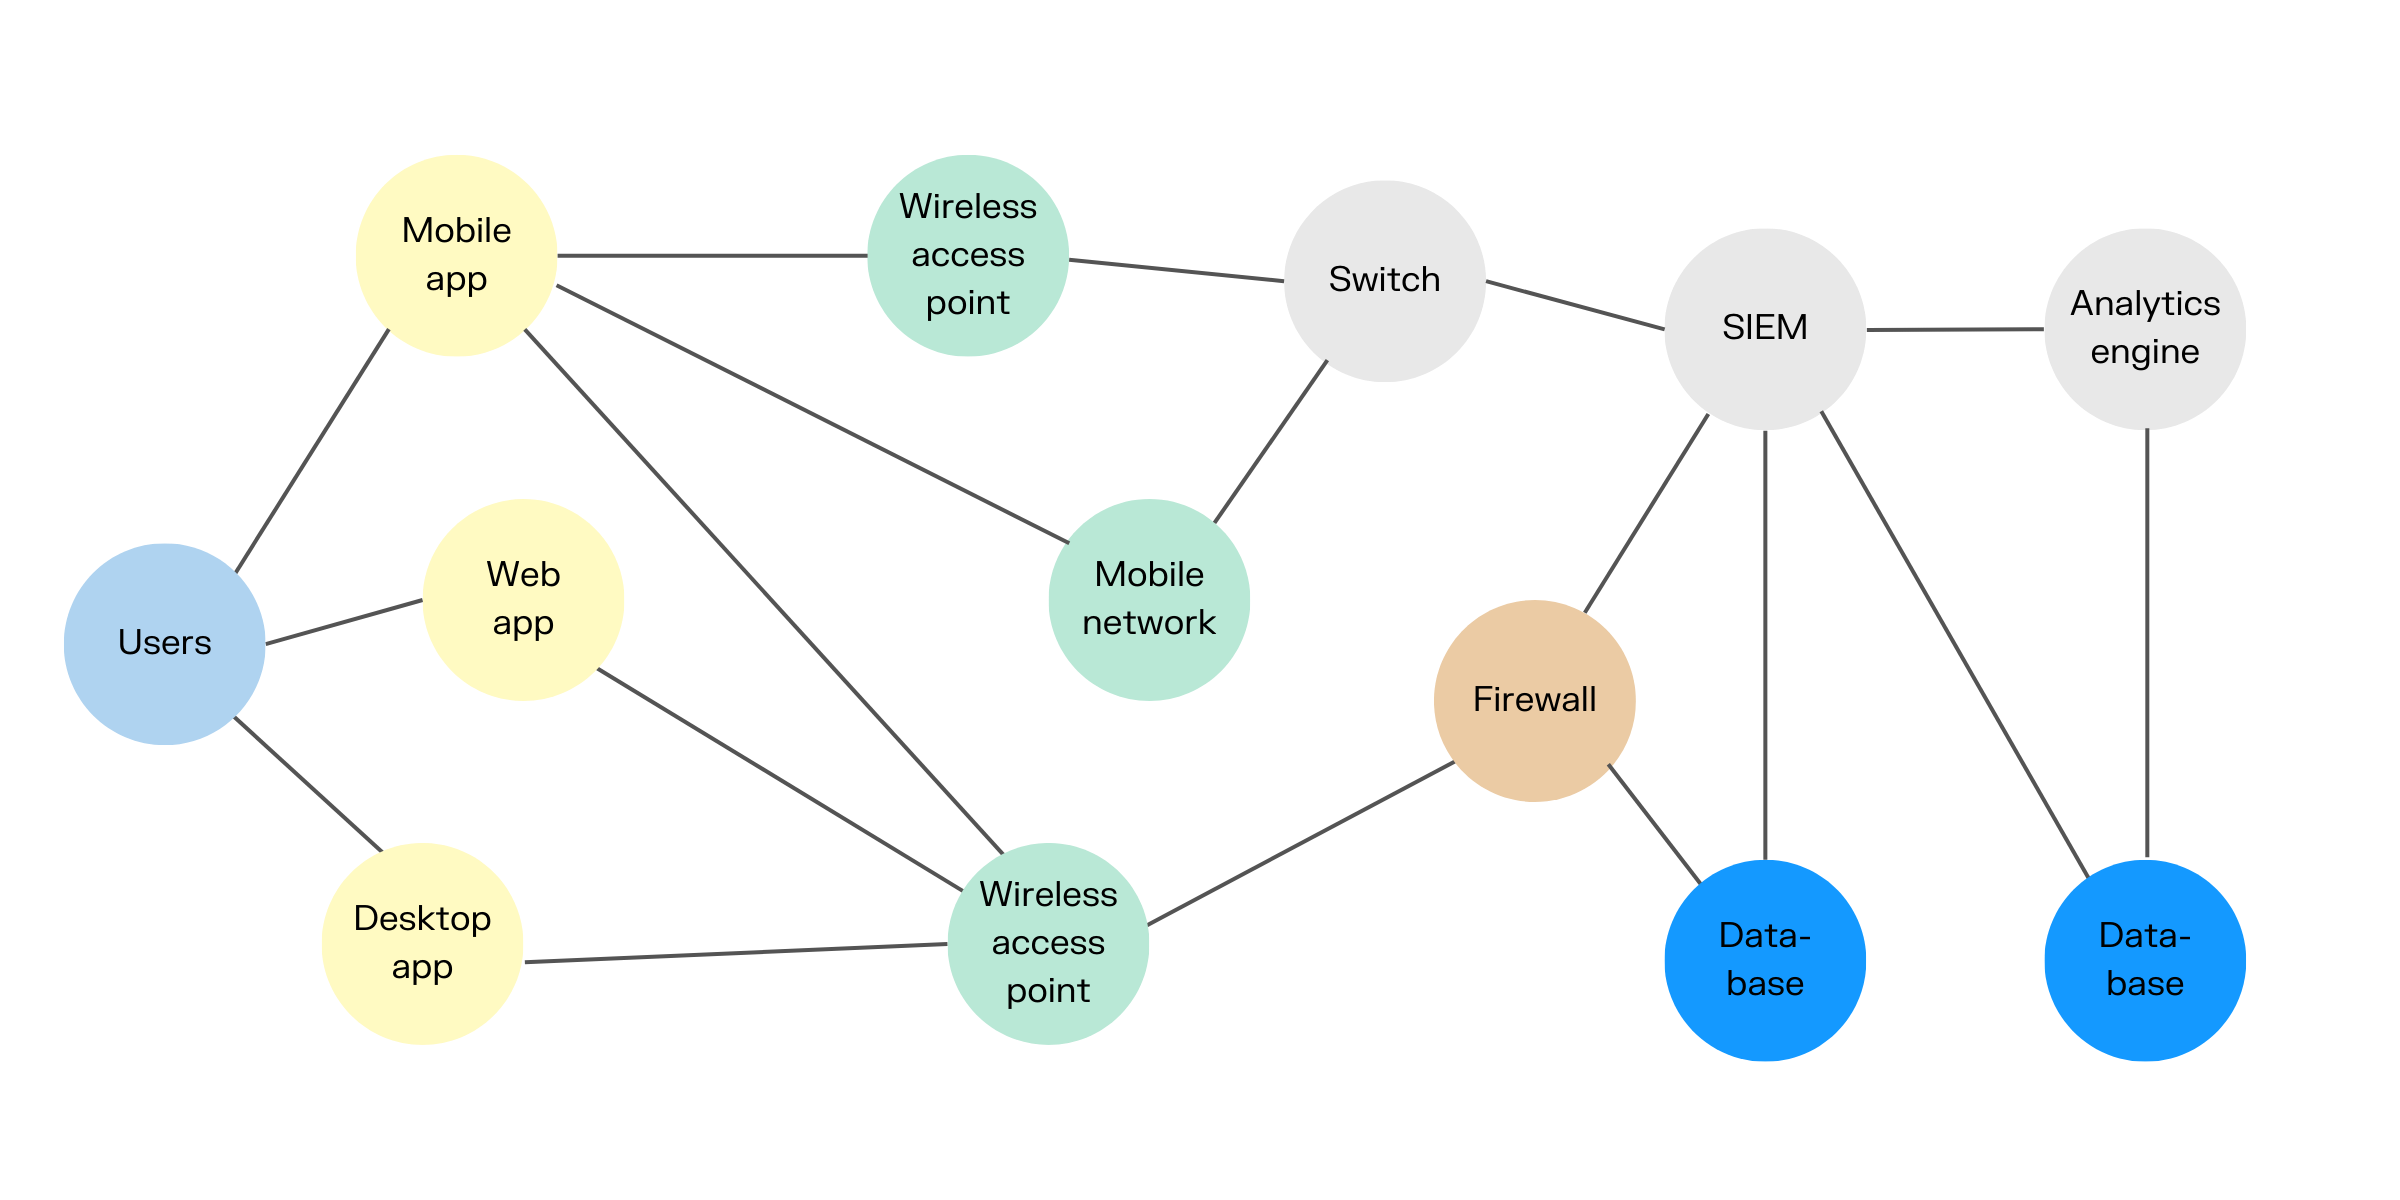
Once you bring data into your cybersecurity digital twin, it will show information like which systems are open to the internet, who your users are and what groups they belong to, user permissions, which systems are connected to which others, etc.
There are many actions you can take on your cybersecurity digital twin. Let’s look at a few examples.
Attack paths look at things from the perspective of a potential attacker, examining the path of a possible multistage attack and the vulnerabilities at each stage.
This type of cybersecurity threat analysis looks at the different paths an attacker may take through your infrastructure. Using graph visualization for this type of analysis is almost indispensable. A visualization makes it fast and intuitive to understand at a glance what different attack paths might be.
Certain factors may increase the likelihood of your organization coming under attack. Mentions in the news may place you on attackers’ radar, for instance. When new loopholes and vulnerabilities are discovered, attackers also won’t hesitate to use them.
It’s possible to ingest data about such vulnerabilities into your graph. Using your digital twin, you can build reports and create alerts about potential security impact, and make proactive changes to your system based on those findings.
No cybersecurity system is perfect, so it’s virtually impossible to prevent all breaches. In cases where an attacker managed to get around your defenses, detecting the attack as quickly as possible will help mitigate damages. Graph can help with this.
Using a tool like alerts in Linkurious Enterprise, you can scan at regular intervals for suspicious patterns of behavior that might indicate the beginning of a cybersecurity attack or other criminal activities that could target your systems or your clients. There are many different types of behavior you can monitor. You can receive an alert if the same IP address has made multiple login attempts, or if you’re receiving many login attempts from an unusual geographic location.
You can set up alerts to flag attack fingerprints that have been seen before. This will let you know if a bad actor (maybe the same one) is following a similar attack strategy.
You can also look for an unexplained traffic surge in your network, which could be the beginning of a DDoS attack.
As organizations continue to strive to secure their environments against the most sophisticated cybersecurity threats, it’s essential to deploy solutions that are up to the task. Graph technology provides valuable insights into the underlying networks of IT infrastructure, giving teams greater visibility to better manage risk.
Linkurious Enterprise provides a graph visualization and analytics solution with a comprehensive set of tools including powerful alerting and advanced collaboration to help you quickly and efficiently gain actionable insights from your IT environments. Try it out today to see how Linkurious Enterprise can help you take a proactive approach in defending your network against threats.
A spotlight on graph technology directly in your inbox.