Transforming electromagnetic spectrum operations in defense with graph analytics
In modern defense technology, the electromagnetic spectrum (EMS) has become an invisible yet critical battleground. Military communications, radar, and electronic warfare systems all rely on this spectrum – making electromagnetic spectrum operations a strategic priority. However, the EMS is a contested domain where adversaries vie for control of frequencies and signals. Traditional tools often fall short in parsing the sheer complexity and scale of EMS data.
That’s where graph analytics in defense comes into play. By treating spectrum data as interconnected networks, graph analytics is revolutionizing how analysts achieve spectrum situational awareness and dominance. The result is real-time insights, smarter decision-making, and greater adaptability even in chaotic operational environments.
Managing the electromagnetic spectrum is about more than preventing radio interference – it’s about gaining a tactical edge. The U.S. military frames this as Joint Electromagnetic Spectrum Operations (JEMSO), which coordinate electronic warfare and spectrum management across all services. In essence, JEMSO is about commanding the invisible battlefield of signals and frequencies so friendly forces can communicate and operate without disruption.
But achieving this requires digesting huge volumes of data (from radar feeds, signal sensors, communication networks, etc.) and understanding complex relationships – who is emitting on what frequency, where interference is happening, how one action in the spectrum affects others. This is a daunting task with conventional tools, which is why defense organizations are turning to graph analytics to connect the dots.
Graph analytics involves modeling data as nodes and relationships – like a big network or web of connections. This approach is proving to be a game-changer for electromagnetic spectrum operations. Why? Because the spectrum problem is inherently one of relationships: relationships between emitters and receivers, interference between frequencies, links between sensors and signals.
Graph technology offers a transformative approach to electromagnetic spectrum management by interconnecting vast and varied datasets and revealing non-obvious relationships critical to operational awareness.
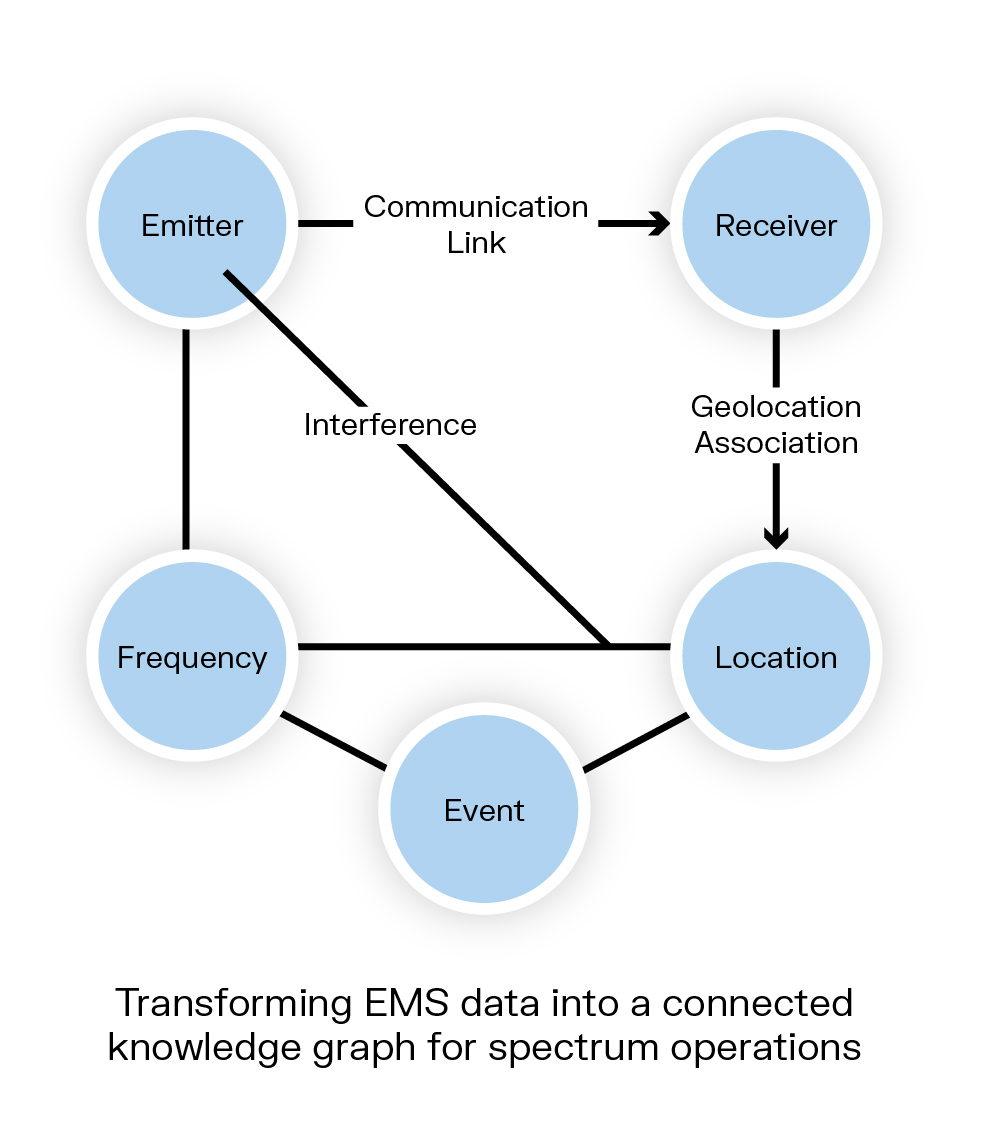
In defense scenarios, graph analytics can integrate data from disparate sources (e.g. sensor networks, communication logs, radar databases) into a single connected view. Instead of isolated data points, analysts see a dynamic spectrum graph where patterns emerge. Hidden links – say, a subtle interference pattern affecting multiple systems – become visible when data is connected as a graph.

By adopting graph analytics, defense technology platforms can expose these hidden relationships and patterns that traditional databases might miss. For example, using a native graph database like Neo4j, diverse spectrum data streams (frequencies, locations, devices, time-series events) are ingested into a connected model that exposes hidden relationships in the electromagnetic environment. Patterns such as a rogue transmitter affecting several communication nodes or a chain of interference events can be spotted quickly.
Specialized visualization tools like Linkurious turn this complex web of data into intuitive network maps, essentially making the invisible visible to analysts. Instead of combing through spreadsheets or static charts, personnel can interact with a living map of the spectrum operations – zooming in on hotspots, clicking on connections, and literally seeing how signals relate.
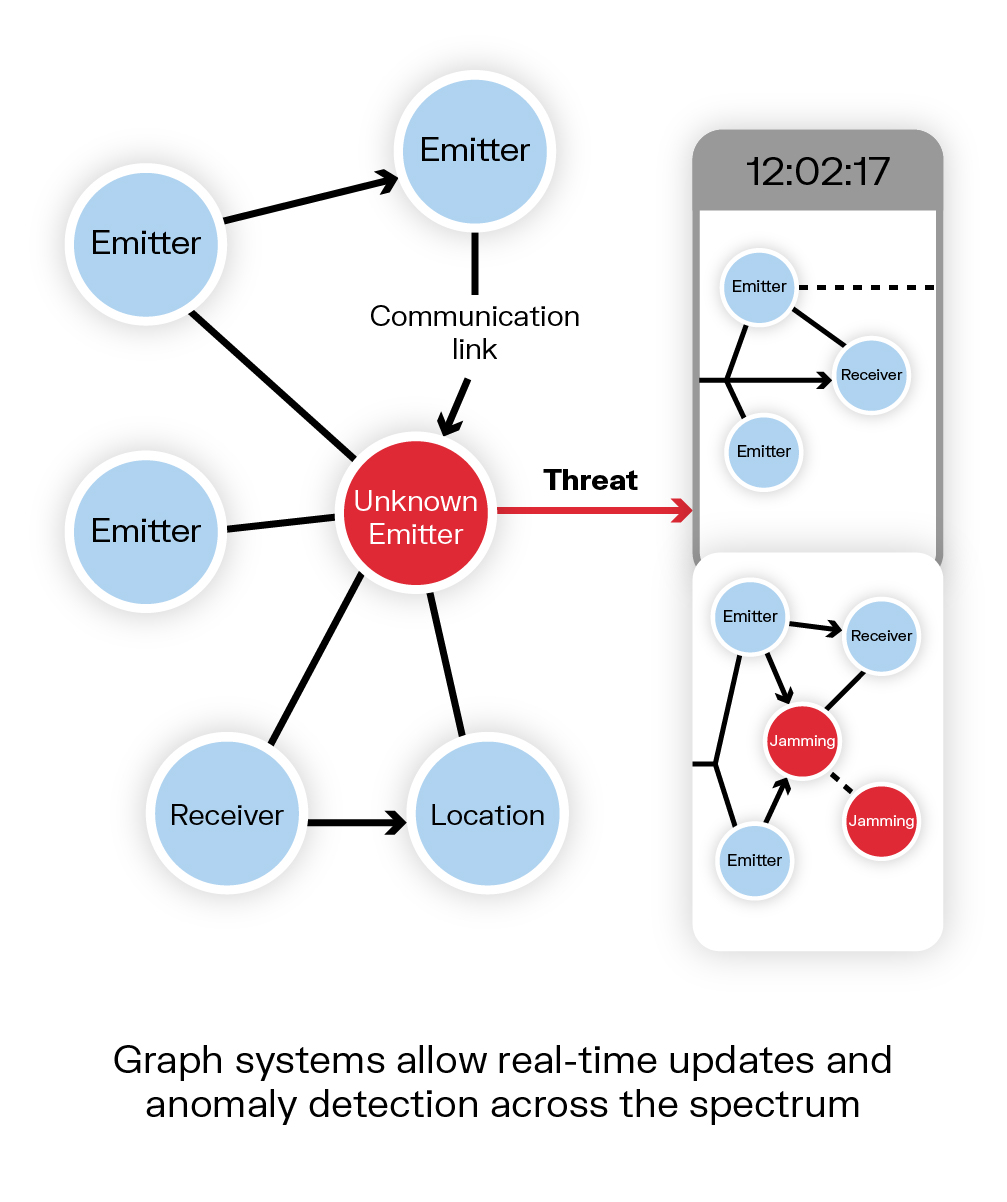
One of the biggest advantages of graph analytics is how it delivers real-time insights. In a fast-paced conflict or training scenario, spectrum conditions change rapidly – new signals pop up, jamming may start or stop, units move and their communications shift.
Graph-powered systems excel at rapid anomaly detection and real-time operational insight. As data streams in, the graph updates to show new nodes or links (for instance, an unknown emitter appearing on a protected frequency). Analysts get alerts about anomalies or suspicious patterns immediately, instead of after lengthy manual analysis. This real-time awareness is crucial for spectrum dominance: it lets decision-makers react to threats or interference as they happen.
Graph analytics directly feeds into spectrum situational awareness. By seeing the full picture of who is using the spectrum and how, commanders and spectrum managers gain an up-to-date map of the electromagnetic terrain. Connecting diverse data in a graph enables operators to turn raw data into actionable intelligence – accelerating response times and enhancing situational awareness across contested electromagnetic environments. Watch our recent webinar to see this in action.
In practical terms, this means a JEMSO team can quickly pinpoint the source of jamming or predict how an adversary’s radar might affect friendly comms, all by exploring the relationships in their data. The graph approach doesn’t just collect data; it contextualizes it. Every signal or event is seen in relation to others, providing true situational context at a glance.
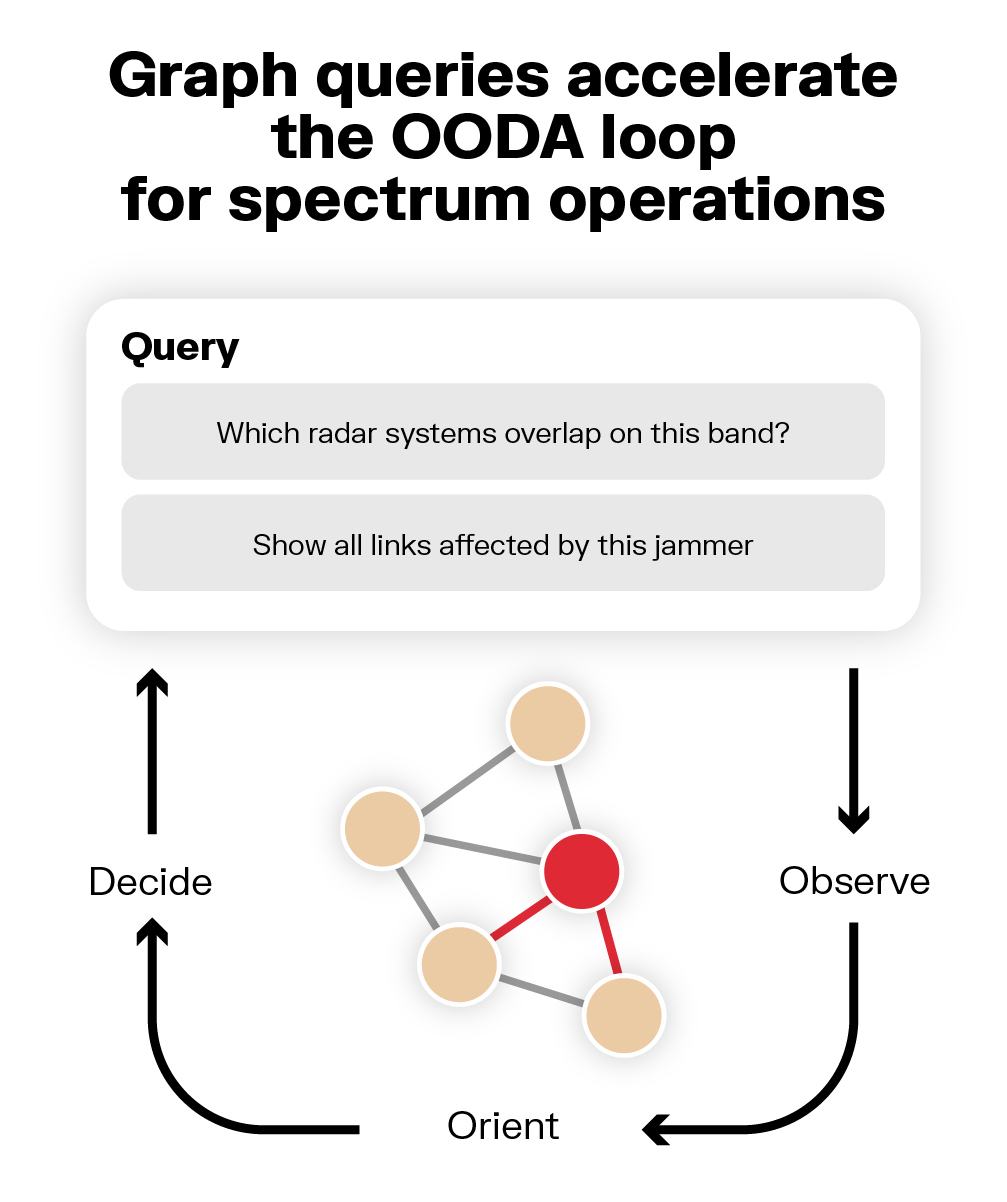
With richer situational awareness comes better, faster decision-making. Graph analytics gives commanders and analysts a decision support tool that reflects the current reality of the spectrum. Instead of making guesses or combing through siloed reports, they can query the graph with specific questions, such as:
- What communication links are at risk if this frequency band is jammed? or
- Which radar systems could be causing this interference pattern?
The answers emerge from the connections in the data.
This connected analysis fosters a new level of collaboration and clarity. Graph-based visuals and queries are more intuitive, meaning complex spectrum scenarios can be understood by a broader range of staff (not just signal experts). This new, connected model for situational awareness and decision-making empowers teams to make informed choices quickly.
In short, graph analytics accelerates the OODA loop (observe–orient–decide–act) for spectrum operations. Decisions that once took hours of data crunching can now be made in minutes, backed by a clear visualization of cause and effect in the EMS. As a result, graph-driven platforms accelerate decision-making and enhance spectrum dominance, giving friendly forces a critical edge in electronic warfare and spectrum management.
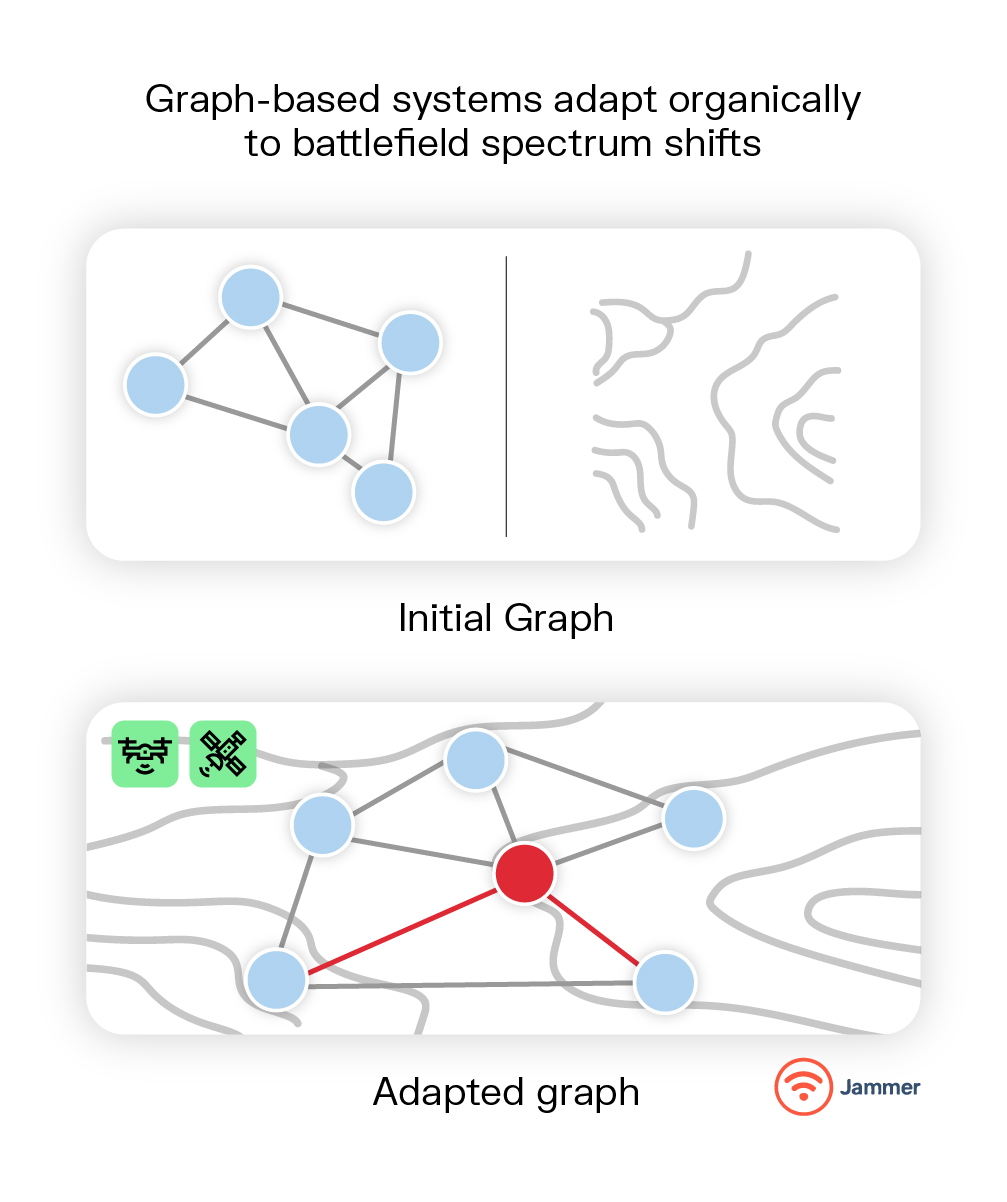
Military electromagnetic environments are among the most complex operational theaters: they’re dynamic, high-volume, and often unpredictable. Graph analytics shines in this complexity by being inherently adaptable. As new data flows in or conditions change, the graph structure adjusts organically.
Think of it like a living knowledge map of the spectrum: if a new threat emerges (e.g., an enemy jammer turns on), it’s instantly represented as a new node or link in the graph. This adaptability means that operators are never looking at an outdated picture. They can re-run analysis or update queries on the fly, confident that the underlying model reflects the latest reality.
Traditional databases might require re-indexing or manual data integration to adapt to new inputs, but graph databases are built for flexibility – adding a new relationship is straightforward and doesn’t disrupt the whole system. In complex operational environments, such resilience is vital. Graph-based systems can integrate with streaming data sources and IoT sensors, adjusting to everything from spectrum congestion in urban landscapes to electronic attacks in the field.
The result is a toolset that bends and flexes with the operation’s needs. In a contested scenario, this could mean automatically re-allocating frequencies to units when a certain band becomes jammed – all guided by the insights from the graph analytics platform. This level of adaptability keeps mission-critical communications and sensors online, even as adversaries try to disrupt them.
To summarize, some of the key benefits of graph analytics in electromagnetic spectrum operations and JEMSO include:
- Real-time insights: Graph analytics enables live monitoring of the spectrum with instant anomaly detection. Analysts gain the ability to spot interference or unusual activity as soon as it occurs. This immediacy supports faster countermeasures and reduces reaction times when facing jamming or signal threats.
- Improved decision-making: By visualizing complex signal relationships, graph tools provide clarity for decision-makers. Patterns that were previously buried in data are now obvious, leading to well-informed strategies. The connected model of spectrum data means decisions (like reallocating frequencies or focusing jamming efforts) are backed by a holistic understanding of the situation. In short, teams operate with greater confidence and precision.
- Enhanced situational awareness: With a graph-driven dashboard, JEMSO teams achieve true spectrum situational awareness. They see every relevant signal, emitter, and interaction in context. This comprehensive view is maintained even in contested environments, helping maintain spectrum dominance. Hidden relationships and dependencies are uncovered, ensuring there are fewer surprises in the field.
- Adaptability: Graph analytics platforms are built to evolve with the battle. They can easily integrate new data sources (from a new sensor feed to an intel report) and update analyses accordingly. This adaptability in complex operational environments means forces can adjust to changing spectrum conditions on the fly, maintaining operational continuity and effectiveness.
To see these concepts in action, consider the work of Expression Networks, a defense-focused technology firm. Expression Networks has been a pioneer in applying graph analytics to spectrum challenges, directly supporting U.S. national security missions. CEO/CTO Dr. Abir Ray – a seasoned expert in EMS operations – has shared how a graph-powered approach is revolutionizing JEMSO by enabling operators to move from raw data to actionable intelligence. Under his leadership, Expression has built solutions that integrate graph databases and advanced analytics to help military spectrum managers make sense of complex data faster.
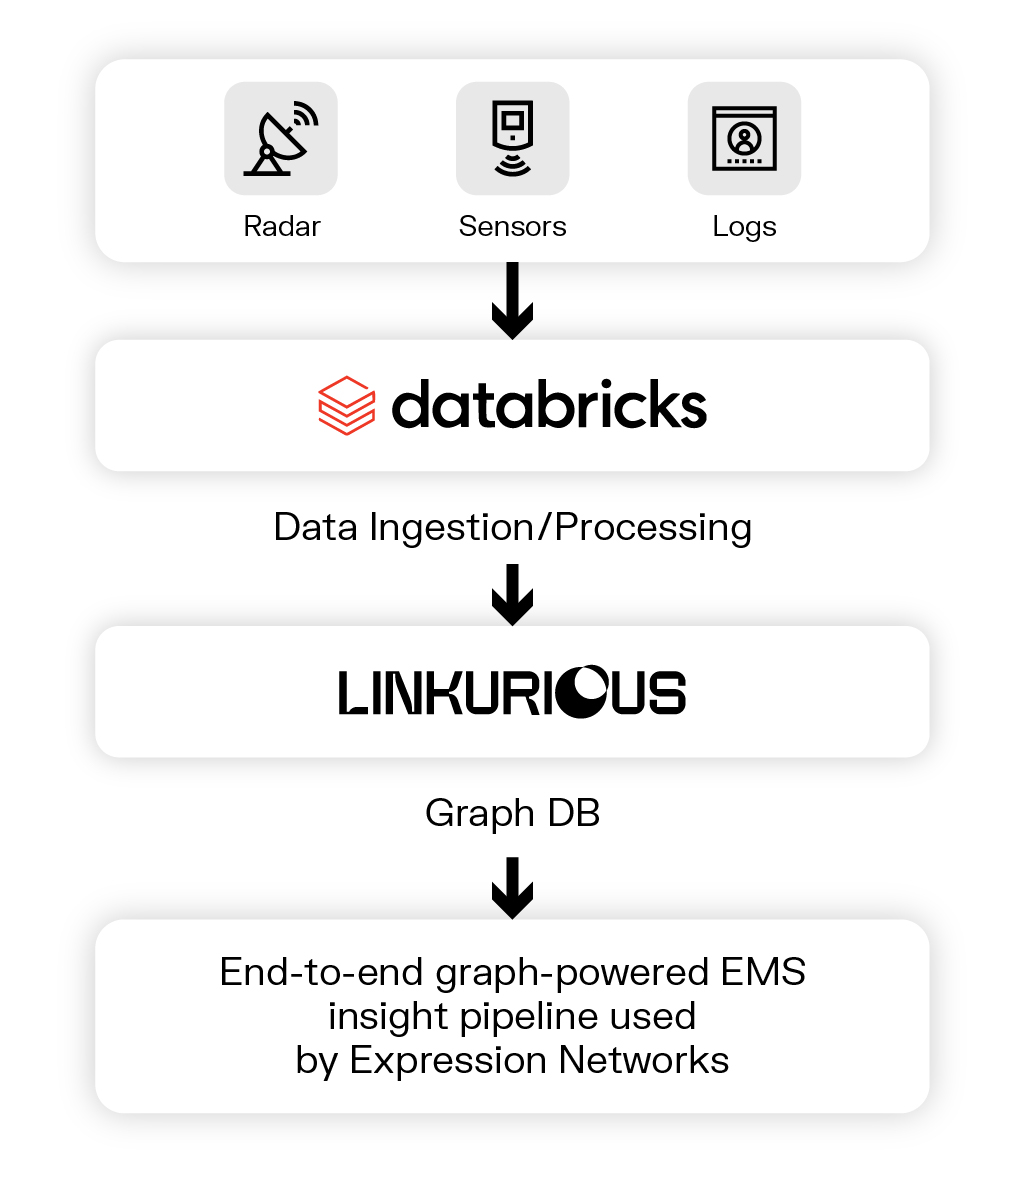
In a recent webinar, Dr. Ray demonstrated how Expression’s team uses Neo4j graph database to connect and analyze complex spectrum data, and Linkurious for visualization. By using these tools, they turn gigabytes of sensor readings and communications logs into an interactive graph of the electromagnetic battlespace.
The outcome? Analysts can literally see what’s happening: Linkurious’ interface makes invisible signals and interference patterns visible as intuitive network visuals. For example, if multiple units report lost GPS signals, the system might visualize a cluster of jamming nodes affecting that region, immediately highlighting a problem source.
This graph-driven approach at Expression Networks has yielded powerful capabilities: real-time detection of anomalies or interference attempts, the ability to do forensic deep-dives on spectrum incidents, and a connected overview for planning and decision support.
Dr. Ray notes that such a platform fundamentally enhances security, speed, clarity and precision in spectrum operations. In other words, the warfighter gets better protected communications (security), faster awareness of issues (speed), a clearer picture of the EM environment (clarity), and more precise control over spectrum assets (precision). These are exactly the outcomes defense organizations need as they strive for spectrum dominance.
It’s worth mentioning that behind these innovations are robust technologies working in concert. Platforms like Neo4j handle the complex web of spectrum entities and their relationships, while big-data frameworks such as Databricks can ingest and preprocess the massive datasets involved. Visualization engines like Linkurious then bring it all to life for the end-user. The beauty of this stack is that the complexity is under the hood – analysts and commanders interact with a clean visual interface and rich queries, not worrying about the heavy data lifting happening behind the scenes. The focus remains on the value these tools enable: timely insight and informed action.
Graph analytics is no longer a theoretical concept for defense – it’s here now, transforming how militaries manage and win in the electromagnetic spectrum. By providing real-time situational awareness, improving decision-making, and adapting to complexity, graph-powered solutions give defense organizations a decisive advantage in the invisible battlespace. The electromagnetic spectrum operations of tomorrow will be defined by those who can best harness their data, and graph analytics is emerging as a cornerstone of that capability.
If you’re tech-curious and eager to stay ahead in the defense domain, now is the time to go deeper. Ready to learn more? Watch the full replay of the Expression Networks and Linkurious joint webinar.
A spotlight on graph technology directly in your inbox.