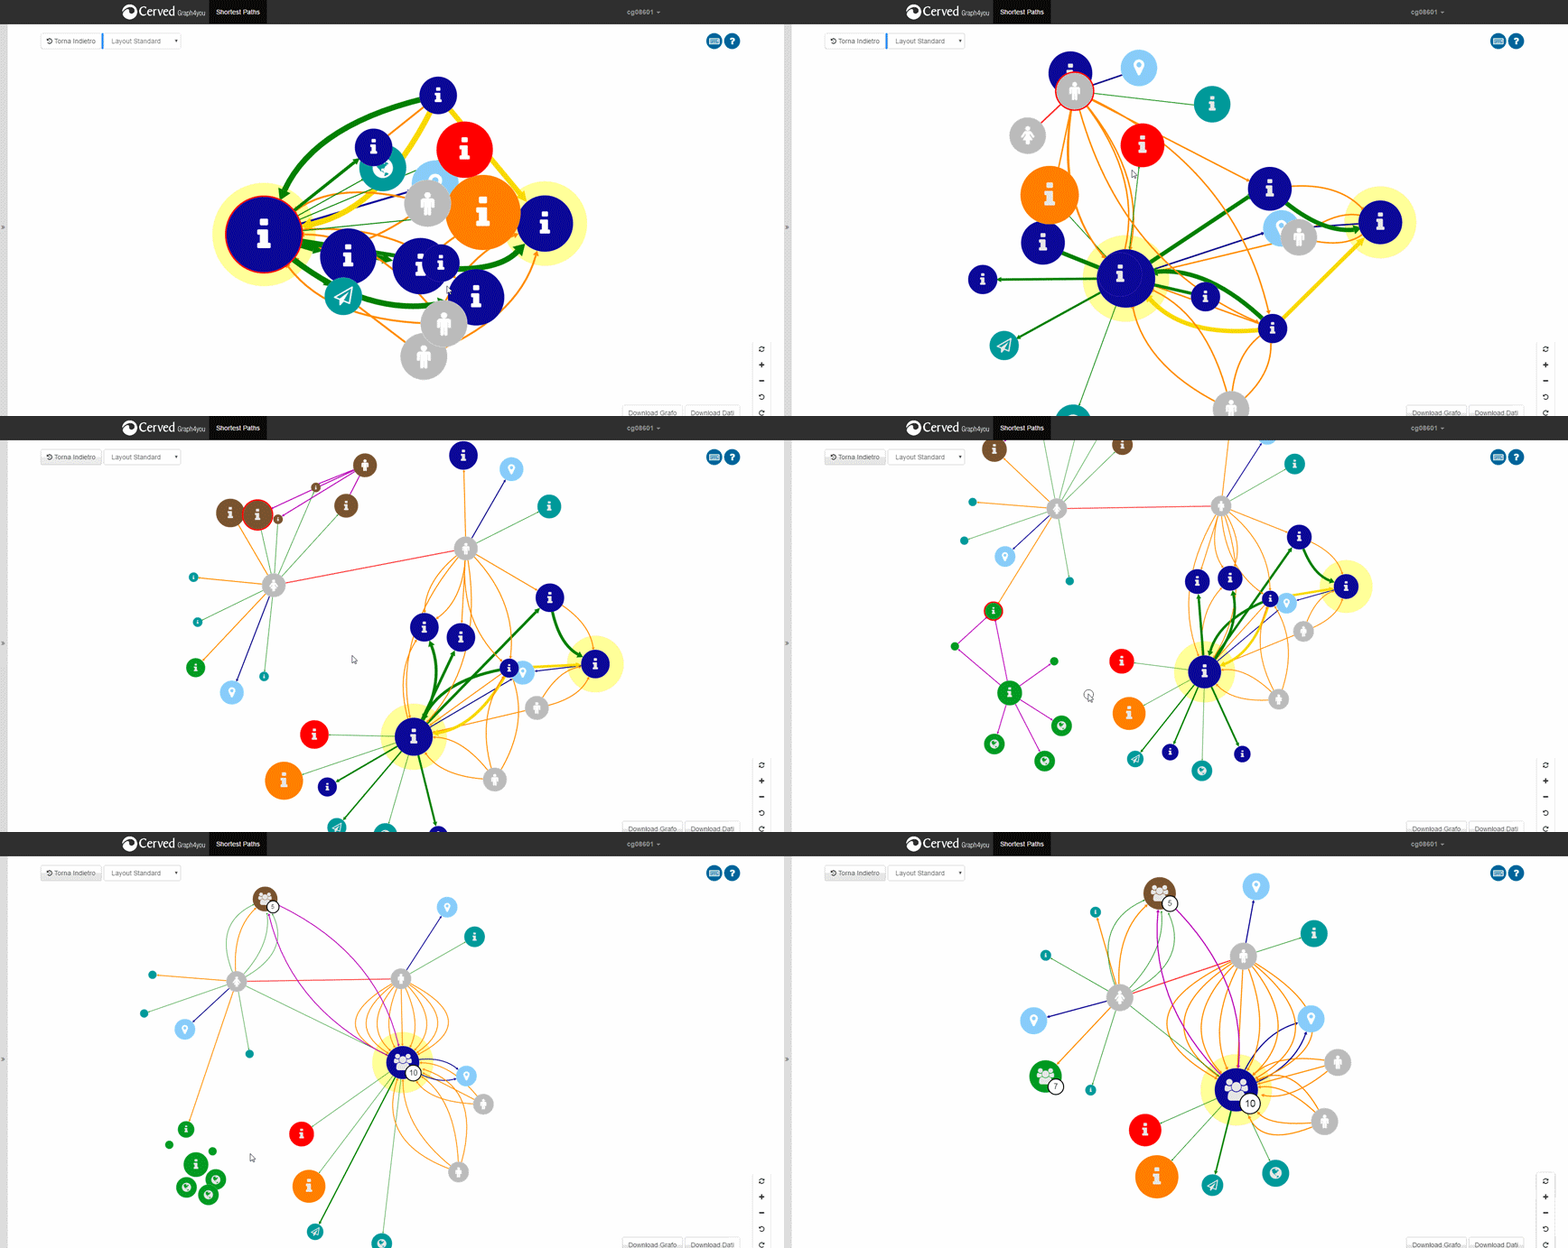
Discover our user stories and learn about the challenges they overcame with Linkurious solutions. In this post we explain how the Cerved team developed a graph-based web-application using Linkurious JS library Ogma to visualize business networks.
Cerved is the Italian data-driven company. It gives businesses and institutions the data to guide their decisions, the tools to understand it and a team of people to turn it into action.
They provide credit information, marketing and credit management services, as well as counting one of the leading European rating agencies within their group. They help their clients manage risk, and opportunities arising from their business relations, assess their partners’ financial profile and their reliability.
Within the group, the Innovation and Data department is in charge of imagining new solutions and services. They work to deliver advanced capabilities to connect businesses to the knowledge and information they need.
Cerved provides its clients with a collection of information regarding the Italian business network, representing more than 6 million companies. These resources, ranging from financial statements to rating analytics, represent gigabytes of data stored in a variety of formats (PDF files, spreadsheet reports, etc…).
« “This type of data requires that users read in a sequential way the information and deal with multiple documents simultaneously" »
The overall size of the datasets, the variety of files and the necessity of helping users quickly analyze connections between information represents a few of the hurdles faced by Cerved’s Innovation and Data team.
« “This is time consuming compared to the possibilities of viewing and exploring a dynamic network. We understood early on that graph visualization was a powerful and intuitive tool to discover valuable information about relationships in complex connected data.” »
Instigated by the requirement of providing their clients with a dynamic way to access and exploit connected data, Cerved’s Innovation team developed Graph4you, a graph-based visualization application.
« “We had no doubt that we needed to make available a product based on graph visual representations and interactions to make a significant difference in how easily and quickly the viewer can identify key patterns from a data set that would be impossible to see in tabular form" »
The team needed an accessible graph visualization JavaScript library to quickly create a minimum viable product of their web-application. The library had to come with advanced features to fit Cerved data specificity and client’s needs such as various layout algorithms, node clustering and the possibility to export the data.
« “We chose the Ogma library because of all the features. Our developer team was immediately able to implement the key features of what was to become our web-app, Graph4you. We found easy to follow an iterative and incremental development thanks to the modularity of Ogma" »
In a few weeks the team had a viable application available for a handful of their biggest customers to try, along with fifty internal associates using it for research purposes.
Today, Graph4you users can investigate a network composed of 30 million of nodes and 60 million of edges stored in a Neo4j graph database. They can query and navigate through the Italian business network to discover connections between entities or get the corporate linkages of companies and individual.

With Graph4you, the Innovation and Data team developed a solution strengthening the value of Cerved data resources. They provided the company and their clients with an intuitive tool to visualize business network and understand the connections within the data, allowing them to easily assess critical insights for compliance with AML regulations and risks assessments.
With Linkurious, the team reported a faster go-to-market process. In a few weeks, they managed to deliver a tailored graph application capable of handling large volumes of connected data and answering Cerved’s clients needs.
« “The principal benefit was the time-to-market. In the MVP stage, we released a product in only a few weeks. Now, Graph4you is a robust application, that thanks to Ogma, allows Cerved to offer the best technology available for a graph-based web application. We are able to manage thousand of nodes on the same graph without problems and at same time produce useful insights for the user" »
A spotlight on graph technology directly in your inbox.

