Cisco is using graph analytics at scale to identify servers controlled by criminals. Here is a quick look at how graphs can improve cyber security.
According to Datanami, “like all big Internet security firms, Cisco collects data from its customers’ firewalls, IPSs, and security appliances so it can better understand and react to evolving security threats, such as zero-day vulnerabilities, spear phishing attempts, and other cybercriminals techniques”.
Instead of each customer analyzing its data and coming up with counter measure against hackers, Cisco looks at the data from all its customers to do the same thing. This way, a new technique used against one organization can be identified by Cisco which will update its software. All Cisco’s customers will benefit from the update.
Of course, analyzing all these data is no easy task :
Today, Cisco’s Global Security Intelligence Operations (SIO) group operates a 60-node, 1,000-core Hadoop cluster based on MapR Technologies’ M7 distribution. Every day, about 20 TB of raw log data lands in Global SIO’s Hadoop cluster in the Silicon Valley from local SIO’s and data centers around the world. The data includes telemetry data collected from Cisco’s IPS, firewall, email, and Web application logs; freely sourced data from the Internet, such as data from Whois, GeoIP, and botnet/darknet data; and malware sandboxing, fire repudiation, and end-user logs from SourceFire FireAMP currently hosted on Amazon Web Services.
All told, Cisco expects to collect up to a million events per second from nearly 100 different channels over tens of thousands of distributed sensors. Making sense of all this structured, semi-structured, and unstructured data is not an easy task, but Hadoop makes it easier.
In order to turn all this information into actual insights that can help Cisco’s customers, Jisheng Wang, technical leader of Threat Research, Analysis, and Communications (TRAC) group at Cisco and his team rely on graph analytics.
An interesting strategy to thwart potential threats is to maintain a list of the compromised domains and IP addresses. Through its data collection program, Cisco has good information on 25 to 30 million Internet domains. It knows which of these millions of domains are controlled by hackers and which are not. It might sound like a lot. But there is an additional 180 million domains on which Cisco has no information.
The challenge is to use the information on the 25 to 30 million domains Cisco knows to learn about the other 180 million domains. Sometimes some of these domains are linked.
Cisco is analyzing IP addresses, registrars and domain names and servers looking for connections.
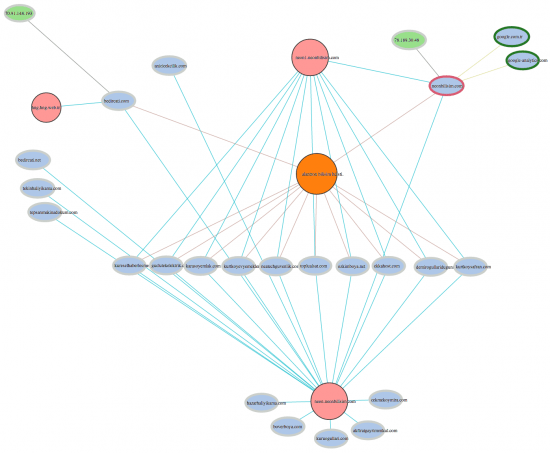
The example above comes from an investigation Cisco conducted on a real cyber attack involving two domains : neonbilisim.com and bedircati.com.
The graph visualization shows what the two suspicious domains are connected to. We can see :
- 23 domains (light blue) ;
- 3 name servers (pink) ;
- 2 IP addresses (green) ;
- 1 registrar (orange) ;
The outer circle color denotes the reputation. Dark green means a very positive reputation and bright red a very negative reputation. Oval nodes represent data proprietary to Cisco and circles indicate open source data.
Using graph analytics, Cisco can use the two domains to discover a series of new suspicious domains that were part of the 180 million unknown domains. These domains have not (yet) engaged in cyber attacks but they are deeply associated with two very bad apples. Instead of waiting for them to be used, the graph analysis make it possible to classify them preemptively as suspicious.
With a tool like Linkurious or a graph database, this analysis is simply a matter of one query.
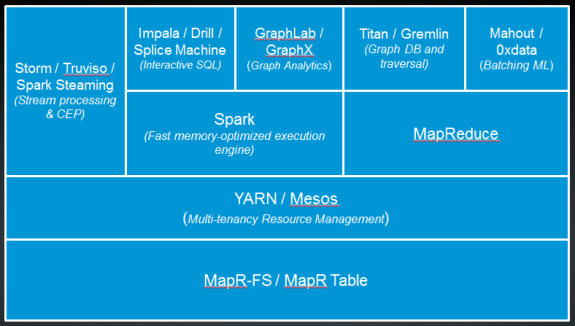
Cisco uses MapR Technologies implementation of Hadoop because of its HBase performance. This runs on a 60-node, 1,000-core Hadoop cluster. Cisco also uses a few graph technologies like GraphLab (a machine learning solution specialized in graph data), Titan (an open-source graph database) and Faunus (an open-source graph analytics engine).
Cyber security is a good example of a domain where graph technologies have a powerful impact. To identify potential threats in big data, companies like Cisco leverage graph analytics and graph visualization…with real benefits.
A spotlight on graph technology directly in your inbox.