Interview with Justice For Myanmar: mapping financial connections to fight violence and corruption
It’s no secret: money and power go hand in hand. The campaign group Justice For Myanmar knows this. To understand and expose the source of power of the violent and corrupt Myanmar military, they’re following the money.
 Justice For Myanmar is a covert group of activists working to expose the systemic causes of inequality, corruption, and atrocity crimes in Myanmar. To bring about change, Justice For Myanmar has been pressuring international businesses with connections to the military to cut those ties and thereby stop those sources of funding.
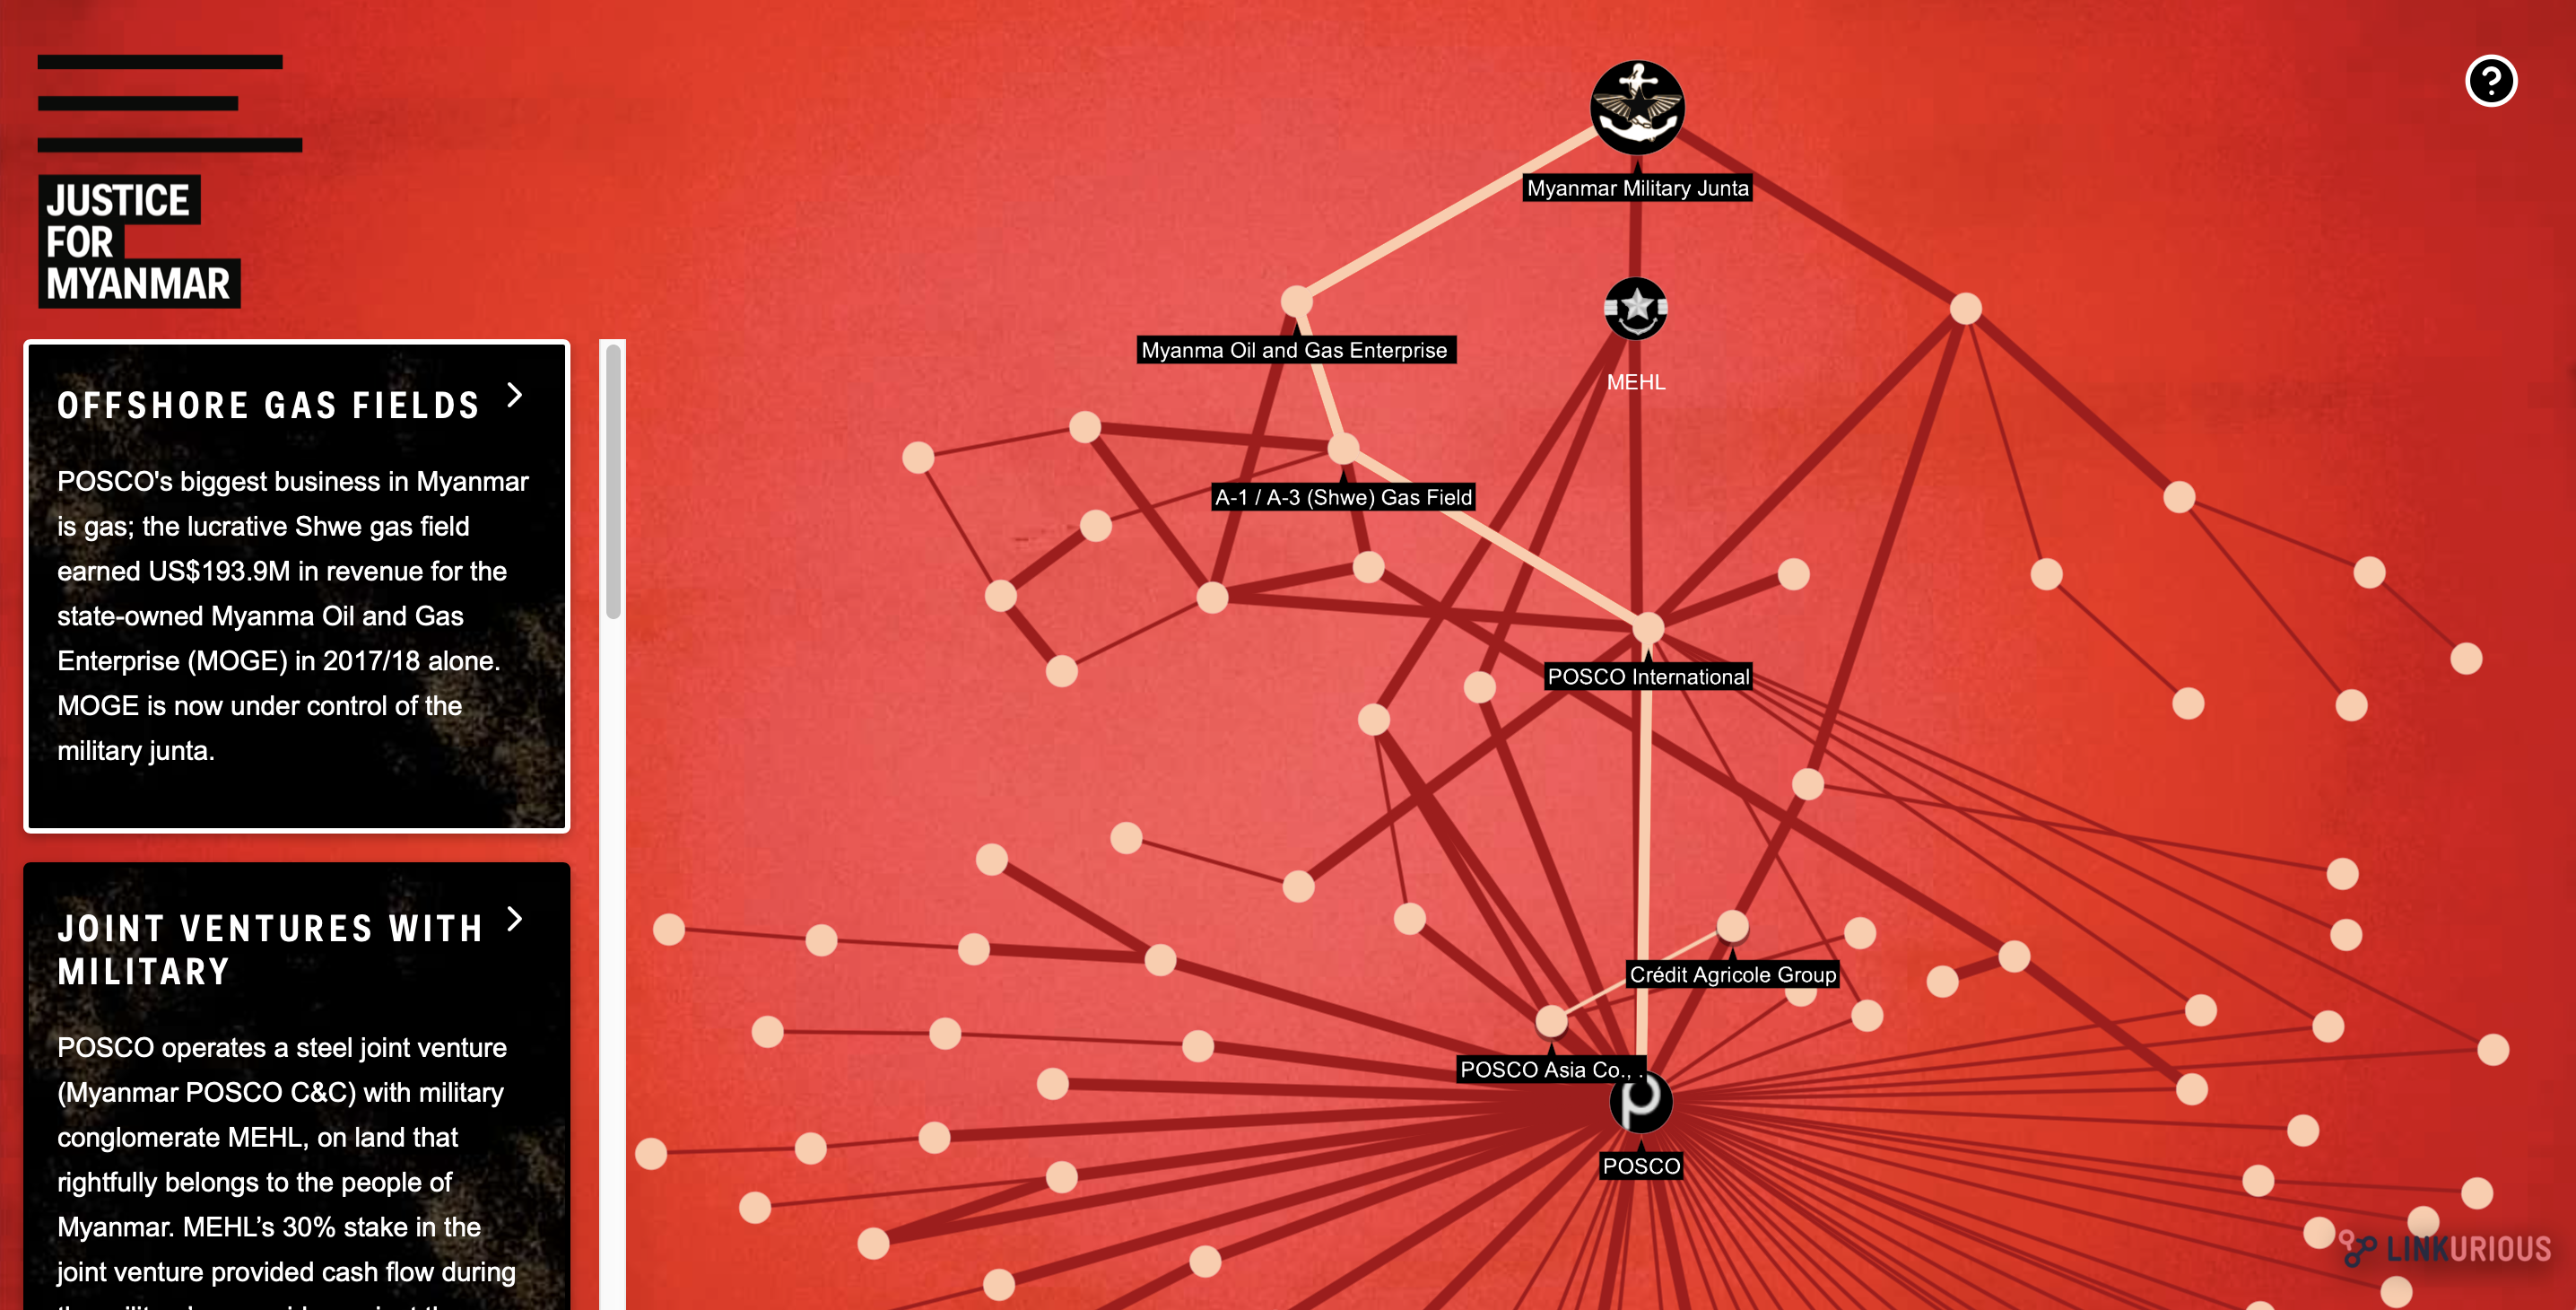
They recently launched the interactive Cartel Finance Map. Justice For Myanmar holds a varied collection of documents in multiple formats and from different sources: information from public databases, leaked documents, company extracts, etc. They had previously illustrated the military’s business connections through text and infographics, but they didn’t show the full extent of this vast financial network.
To maximize the impact of their data, Justice For Myanmar took a graph technology approach, in which information is structured as a network clearly showing the relationships between data. With the help of the Linkurious investigation platform and a Neo4j graph database, they mapped out the military’s secretive relationships and financial connections. Being able to visually explore these relationships brings hidden connections to light, uncovering insights that might otherwise be difficult to see.
The aim of the Cartel Finance Map is to call attention to the businesses that are directly or indirectly financing the Myanmar military and contributing to the Myanmar people’s suffering. Beginning with the South Korean steel conglomerate POSCO, anyone can explore how the company’s business ties link back to the military. Justice For Myanmar has plans to expand the project.
We asked Justice For Myanmar about the Cartel Finance Map backstory: how the project came about, what the significance of it is, and how graph visualization makes for impactful storytelling.
Why did you feel it was important to look at the money trails connecting to the military?
The military in Myanmar functions as a massive, institutionalized cartel, hiding its financial operations in plain sight behind a secretive network of shell companies touching banking, trade, logistics, construction and mining, tourism, and agriculture. Holding companies and private companies locally and abroad allow for corruption, illicit trade — and big profits. The Cartel Finance Map is a revolutionary tool that visualizes the links that extend from the country’s most violent generals towards corporations in major capitals across the world.
What impact would it have if more businesses cut their ties with the military and entities that are connected with it?
With more people discovering the way the country’s cash flows fund a brutal regime that commits genocide, war crimes and crimes against humanity, we can cut the military junta’s power off at its source. We’ve already seen that our commitment to exposing hidden links actually works. The movement against the military’s business networks has spread across the world, and the military is losing its profits. As of the first anniversary of the campaign launch, some of the major military business targets have been forced to take action in the wake of our campaign and subsequent investigations by journalists around the world.
How did graph visualization help tell this story around the military’s financing?
The visualization has helped turn data into an opportunity for action. By making this trove of data accessible and easy to parse, we have been able to put pressure on key corporations and governments locally and internationally to ask them to look at their role in funding this brutal regime.
The visualization has served as a key input for journalists to begin their own in-depth investigations. It has also offered a simple and clear way for members of the public to see how their own lives are touched by this: from the beer they drink, to the pension funds their money is invested in.

Was there anything you found particularly eye-opening once your data was mapped out?
The graph visualization really illustrates just how vast the Myanmar military’s business interests are, much more so than browsing through hundreds of rows in a spreadsheet. Additionally, it becomes much easier to see how various partnerships mask the connections between these businesses – but there’s always a money trail back to the Myanmar military.
What was your approach to this project? Are you satisfied with the results?
There are hundreds of international and domestic companies engaged with military-owned businesses in Myanmar. These businesses contribute to immense wealth for the military and top generals, which fuels crimes against humanity. We want to disrupt that and are putting pressure on military linked businesses one by one. Success is measured by businesses divesting. Our approach is to:
- Expose international businesses with financial ties to Myanmar’s military with the release of sourced evidence.
- Dismantle the military cartel through campaigns for boycotts, divestment and targeted sanctions.
- Pressure businesses to divest or otherwise take action with the continued sourcing of new evidence.
The Cartel Finance Map is one tool we are using to highlight these business connections and put pressure on companies. The first target story for the Cartel Finance Map – South Korean steel conglomerate POSCO’s ties to the military – was picked up widely by major international press and spurred independent investigations. Less than a month after release, POSCO terminated a steel joint venture with Myanmar Economic Holdings, a company controlled by Myanmar’s military.
How was Linkurious useful for this project?
Linkurious provided our team with flexible and powerful tools for visualizing and exploring complex relationships in the data without having a BSc in data science.
The ability of Linkurious technology to bring our user-experience design to life has been essential. The graph library includes a lot of visualization features out-of-the-box, and leveraging that work made this project happen much more quickly. Throughout the development process our team was able to rapidly try out different approaches to the visualization, playing with size, color, iconography, highlighting paths, tooltips, what is or is not shown by default, and much more. In the end we opted for something that was simpler and got the key points across, rather than giving the end-user an overwhelming number of controls and visual inputs.
Keeping the dirty money of corrupt politicians and their networks out of the financial system and identifying high risk customers are critical to ensure compliance. OpenScreening is a free tool that combines open data sets for PEPs and sanctions screening unified into a single database powered by cutting edge graph technology. Try it now!
A spotlight on graph technology directly in your inbox.


