Seeing the ROI of research: How Monash University uses graph and AI to map research value
Monash University in Melbourne, Australia is a major hub for research and innovation. Home to more than 95,000 students and a thriving academic community of thousands of leading researchers, Monash produces over 7,300 publications annually.
Like many universities, it has long been challenging for Monash University to gain a precise understanding of the impact of various investments at the university. Led by Dr. Mahyar Nasabi, the Systems & Analytics team has worked closely with Amazon Web Services (AWS) to take an innovative approach to understanding return on investment (ROI) in university research. By combining graph technology with artificial intelligence (AI), they’ve developed a tool that delivers precise insights into how university investments are paying off—and gives administrators, researchers, students, and other stakeholders a new way of making connections across university equipment, personnel, and research output.
This case study looks at how they built their tool, and the value it delivers to a diverse group of stakeholders in the university ecosystem, from students to researchers to university administrators.
Monash University, like any major research institution, makes substantial investments in specialized equipment for researchers. Some of this equipment, like MRI machines, advanced electron microscopes, etc. can cost millions of dollars. With such significant expenses, it is essential for the university to understand their impact.
“It’s not necessarily about money, but about societal impact and university influence,” says Dr. Mahyar Nasabi, Program Manager of the Systems & Analytics team at Monash. “A higher number of research publications can mean better university ratings, more notoriety for the university, more patents attributed to university researchers, etc. Financing is also done by grants, and proving ROI can lead to more grants.”
The work of evaluating ROI has fallen to the university’s research performance team. Their job is to understand how and when university equipment is being used. Until recently, this process had been a manual one: they read research papers, which may have titles that are difficult to parse, to evaluate exactly which equipment has been used to write the papers. In such a manual process, some information can fall through the cracks.
It was also time-consuming. Dr. Nasabi gives an example: “The research performance team had to analyze 300 of the university’s high profile research papers. To do this, the team had to spend roughly 30 minutes per paper which is equivalent to 2 weeks of highly knowledgeable senior team member’s time.”
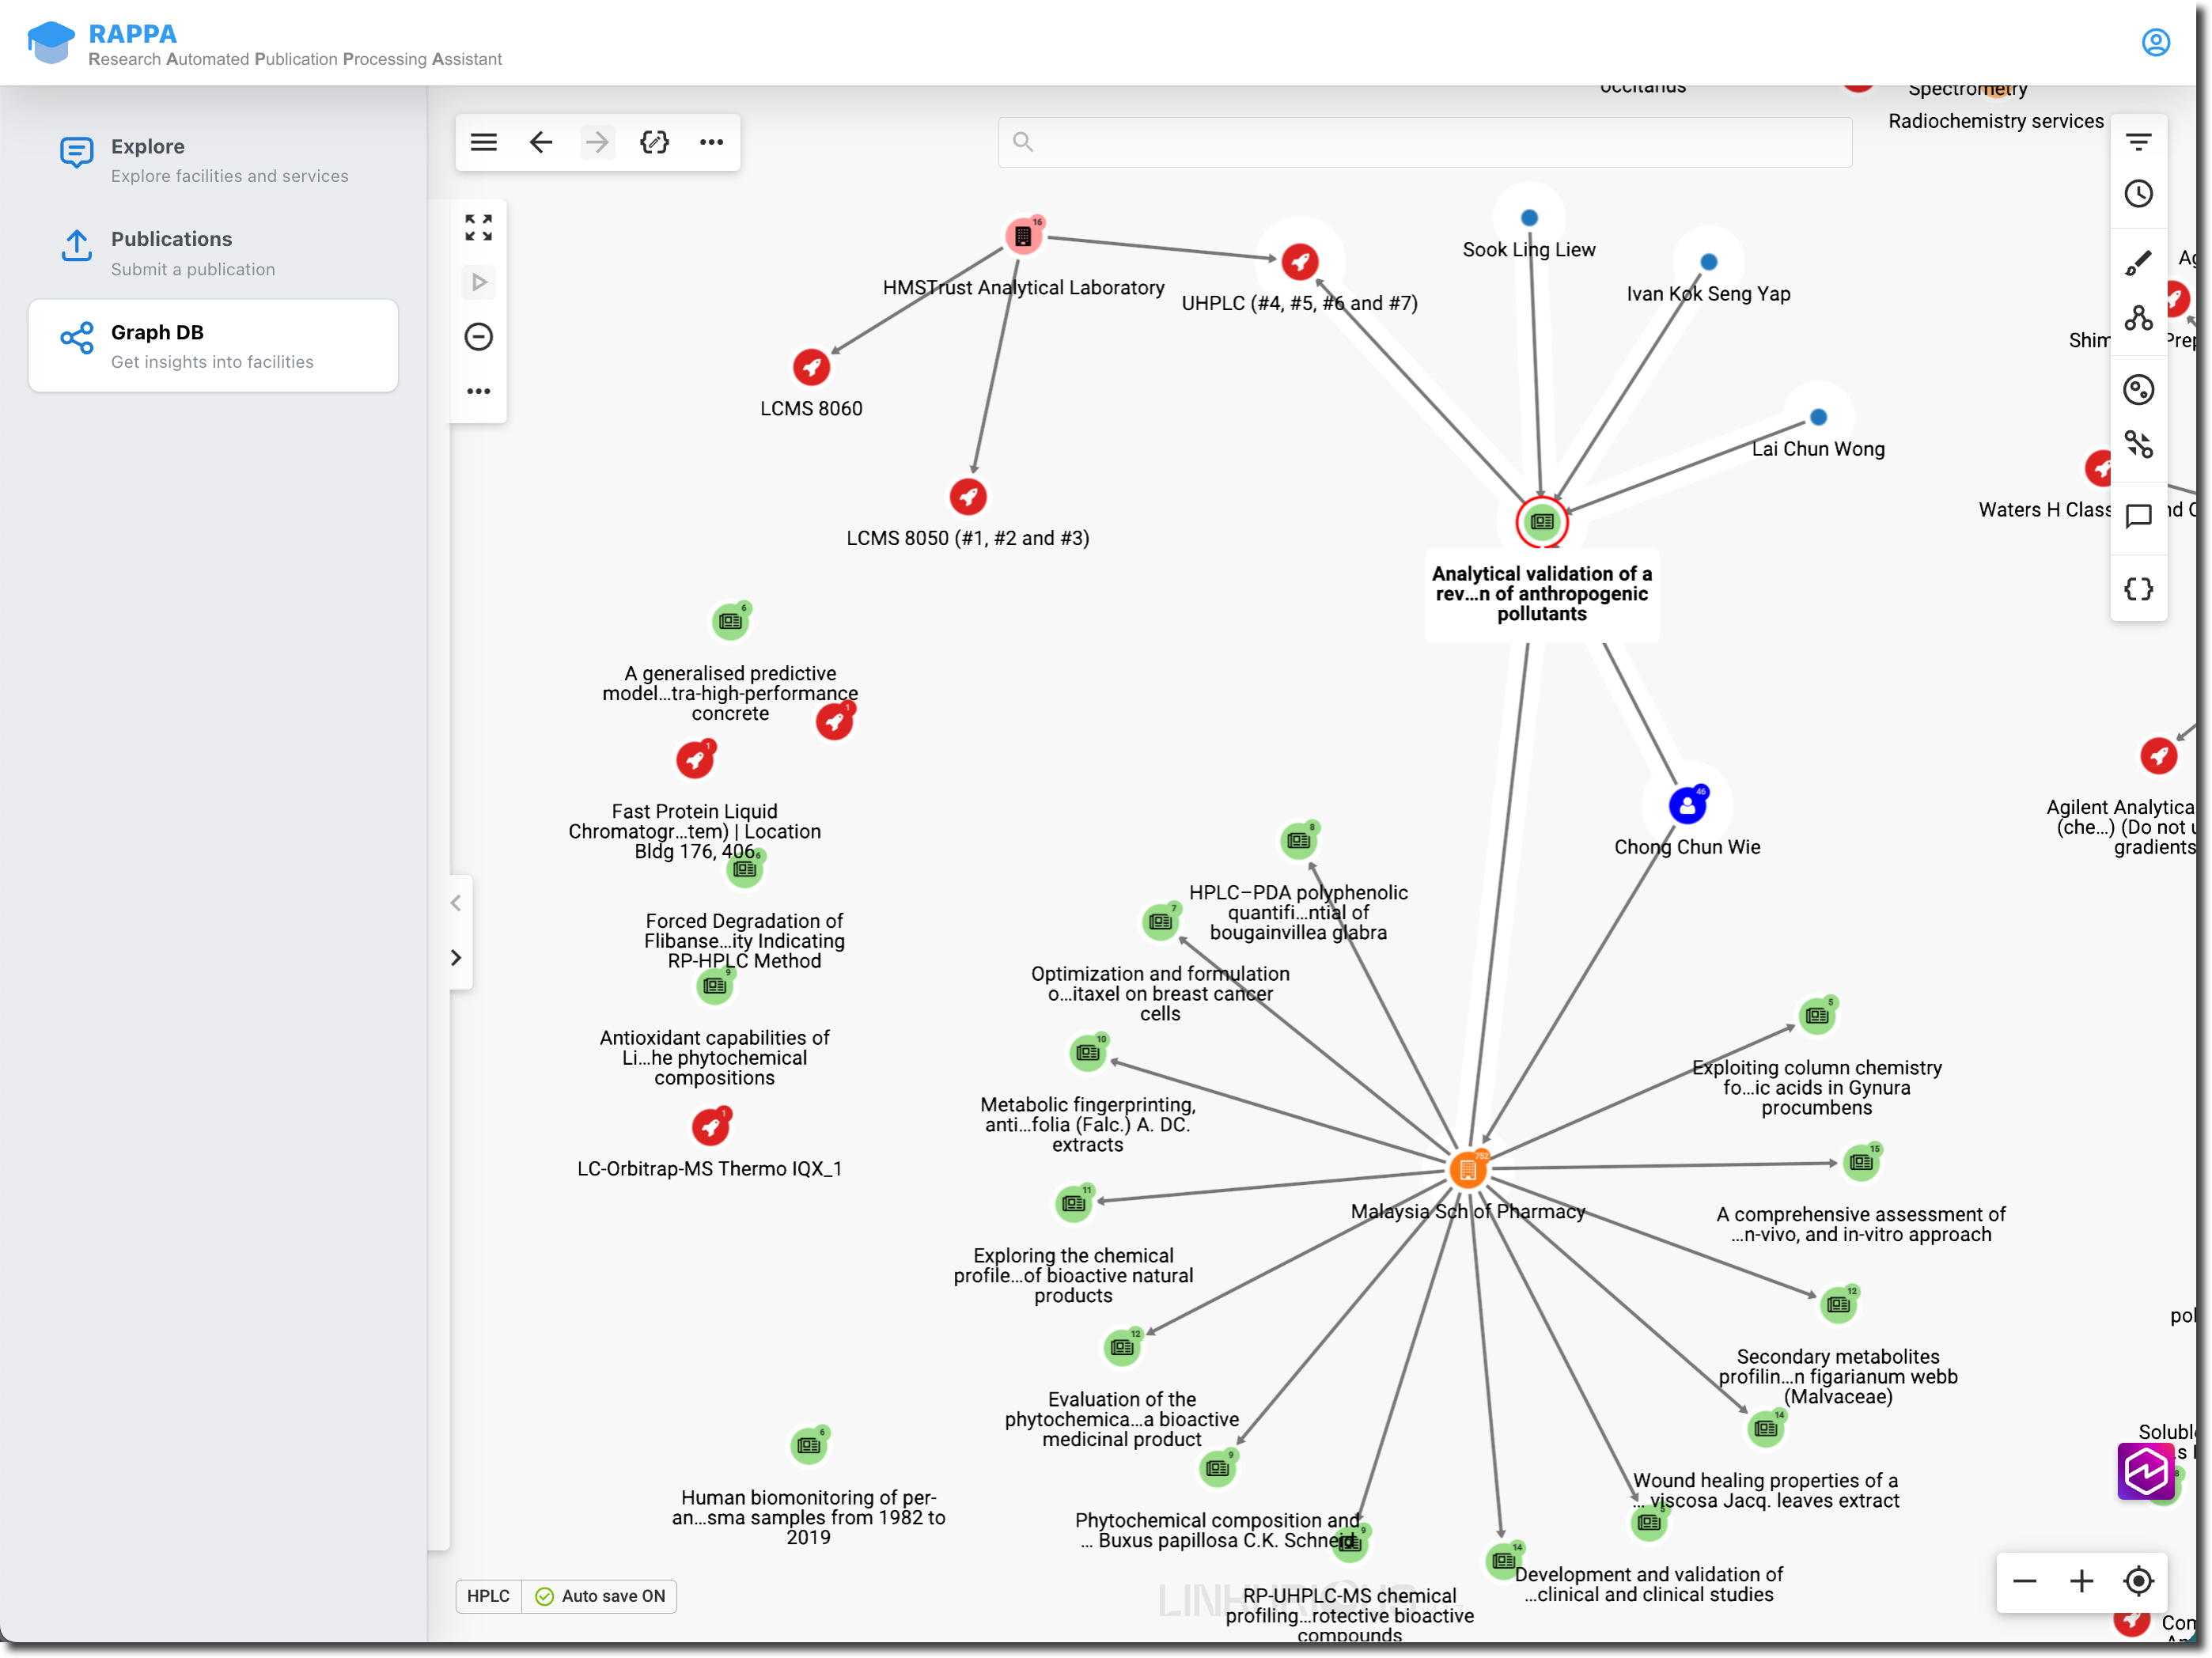
New technology has offered a more efficient and user-friendly way to analyze the ROI of the university’s biggest equipment investments. Enter the Research Automated Publication Processing Assistant, or RAPPA. RAPPA combines artificial intelligence and graph technology, letting university administrators quickly understand how strategic research equipment has been used and what the results have been, as well as linking the utilization to the research output. It also acts as a portal for other university stakeholders, including students and researchers, helping them understand and visualize the resources available to them and the research landscape at Monash University.
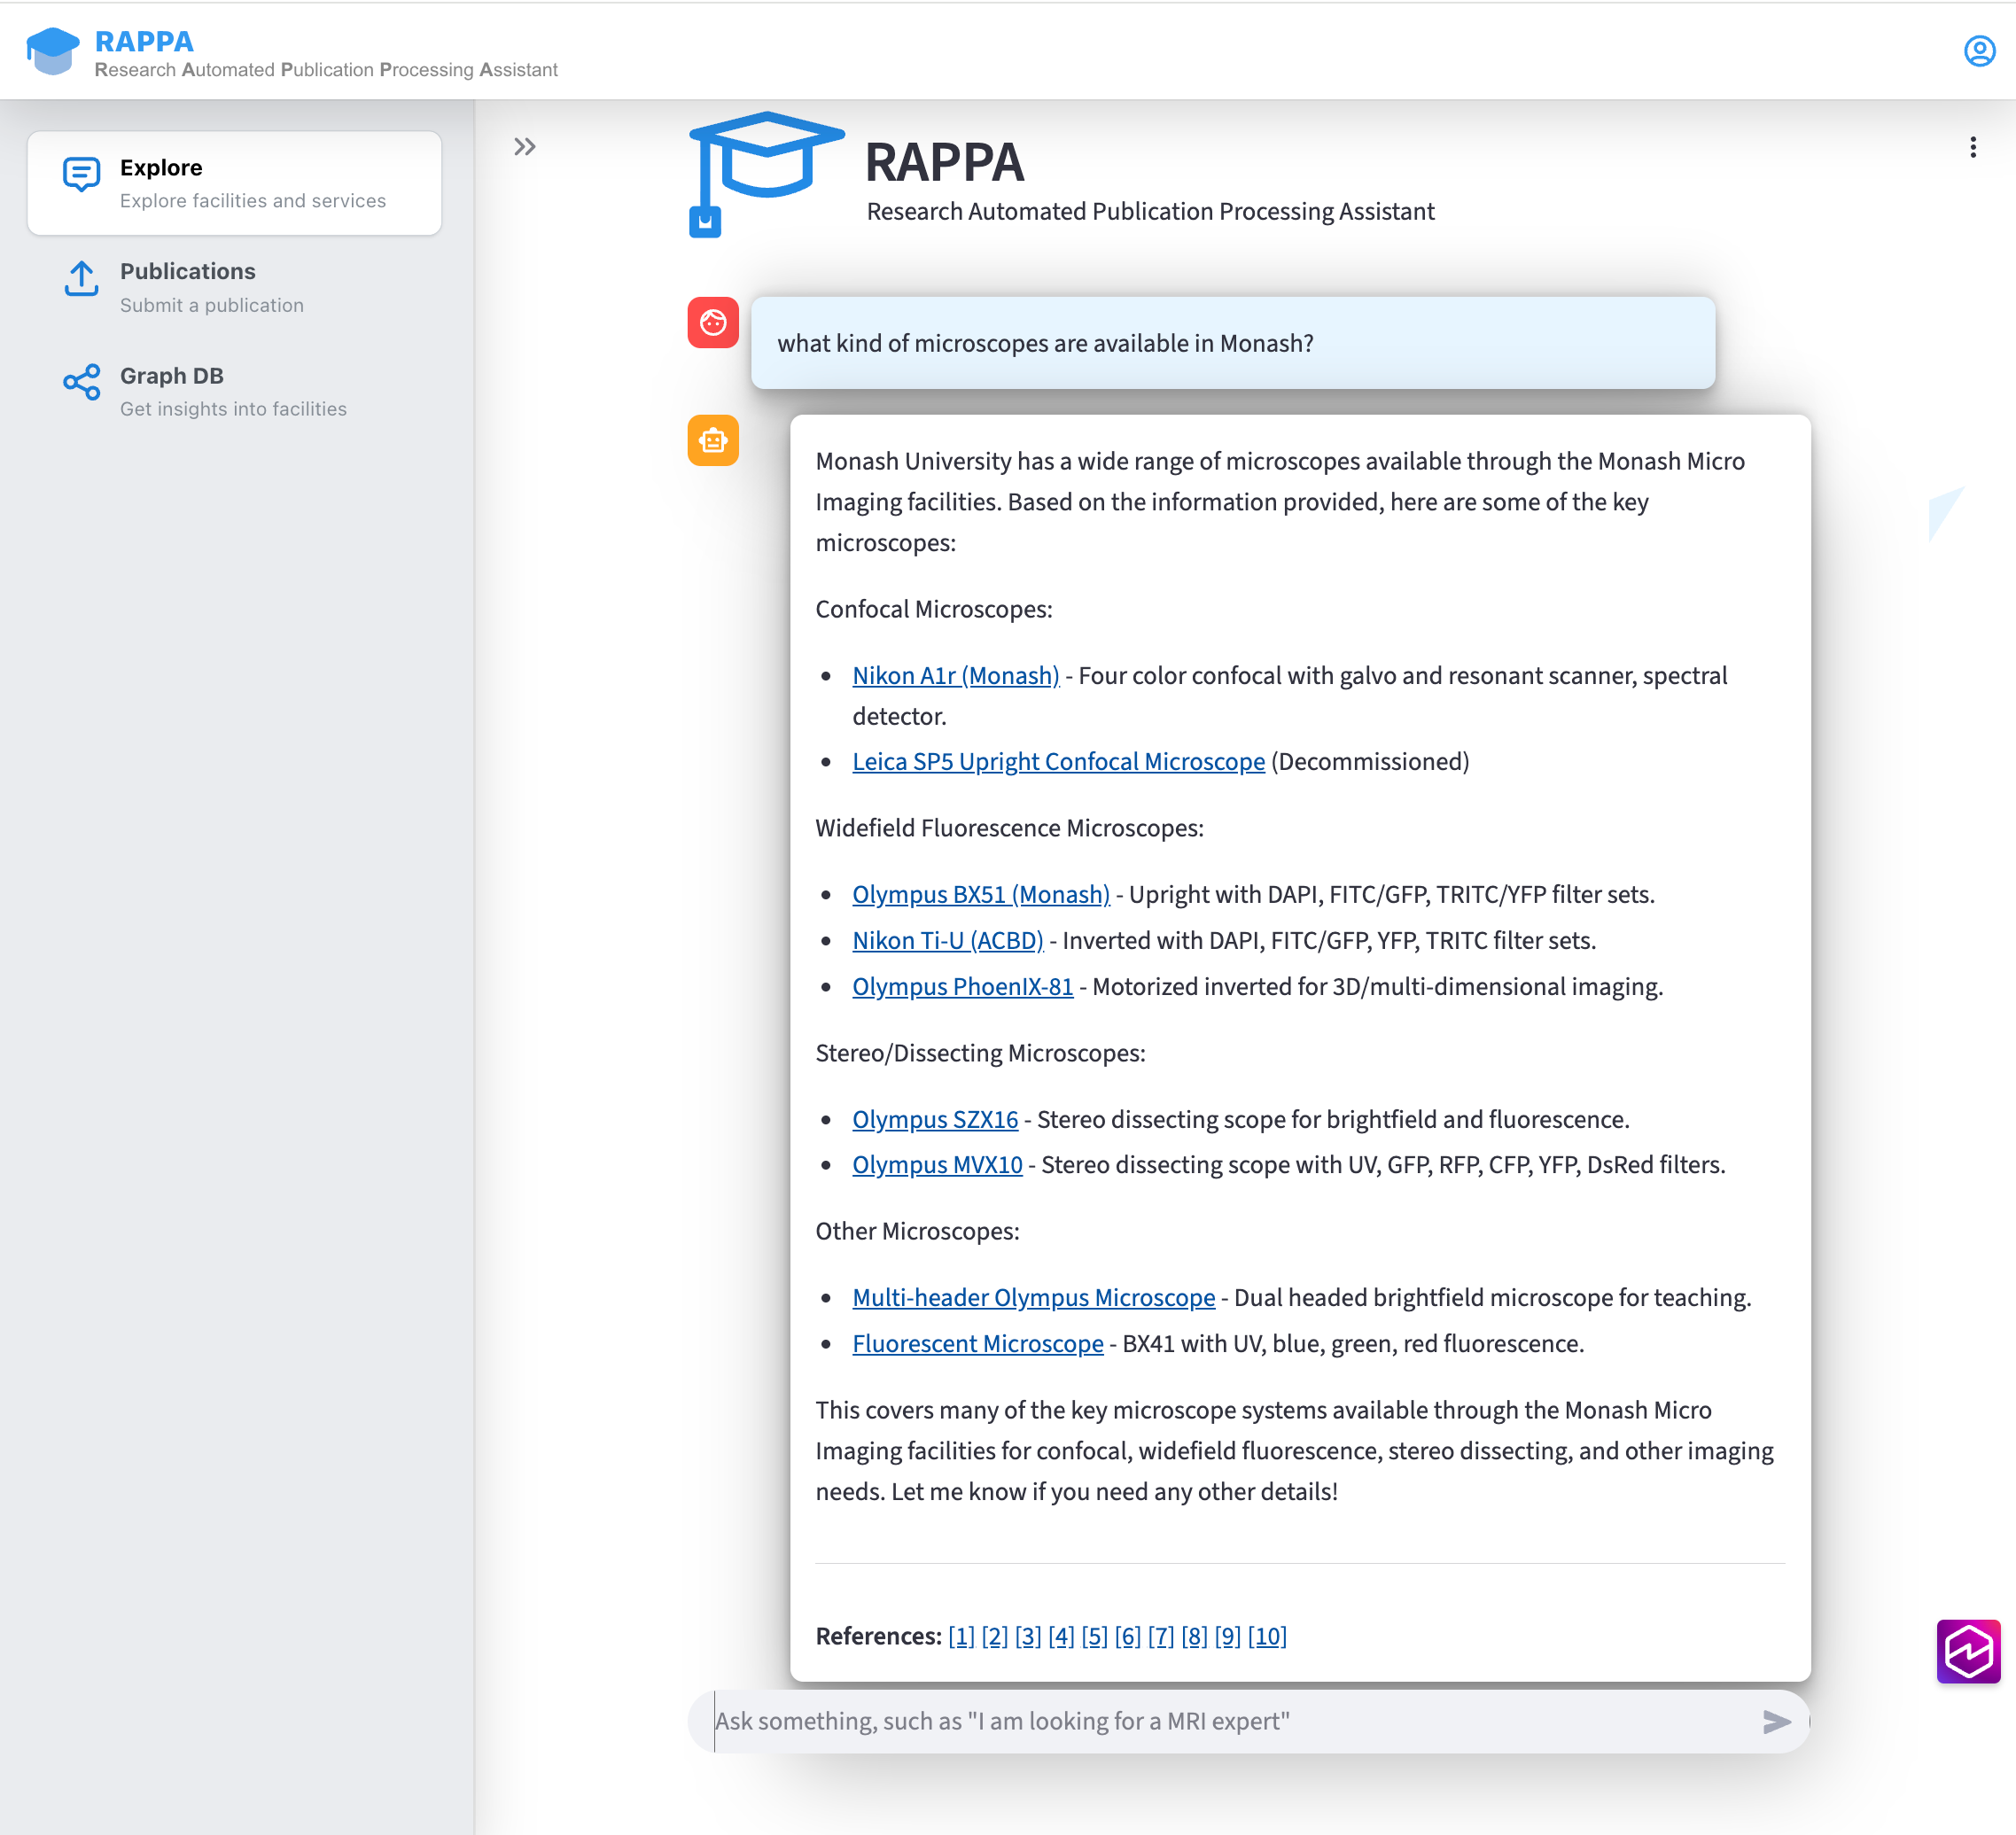
RAPPA has a large language model (LLM) interface that users can interact with to find answers to their questions. It also has graph visualization capabilities that display networks related to equipment, research, and researchers.
“RAPPA came about from the need to make strategic decisions,” says Dr. Mahyar Nasabi. “You can’t make a strategic narrative by looking at research capabilities in silo, you have to be able to understand the linked research output and preferably visualize the link.”
RAPPA offers exactly this: an efficient way to understand research output at the university, accessible to everyone, regardless of their technical know-how.
RAPPA lets university administrators and other stakeholders search for key information through a chatbot using natural language. Users can use any number of starting points to explore information in RAPPA, depending on what they need to find. They might search for a specific research paper to see what equipment was used in the process or look up a certain piece of equipment to see which papers mention it.
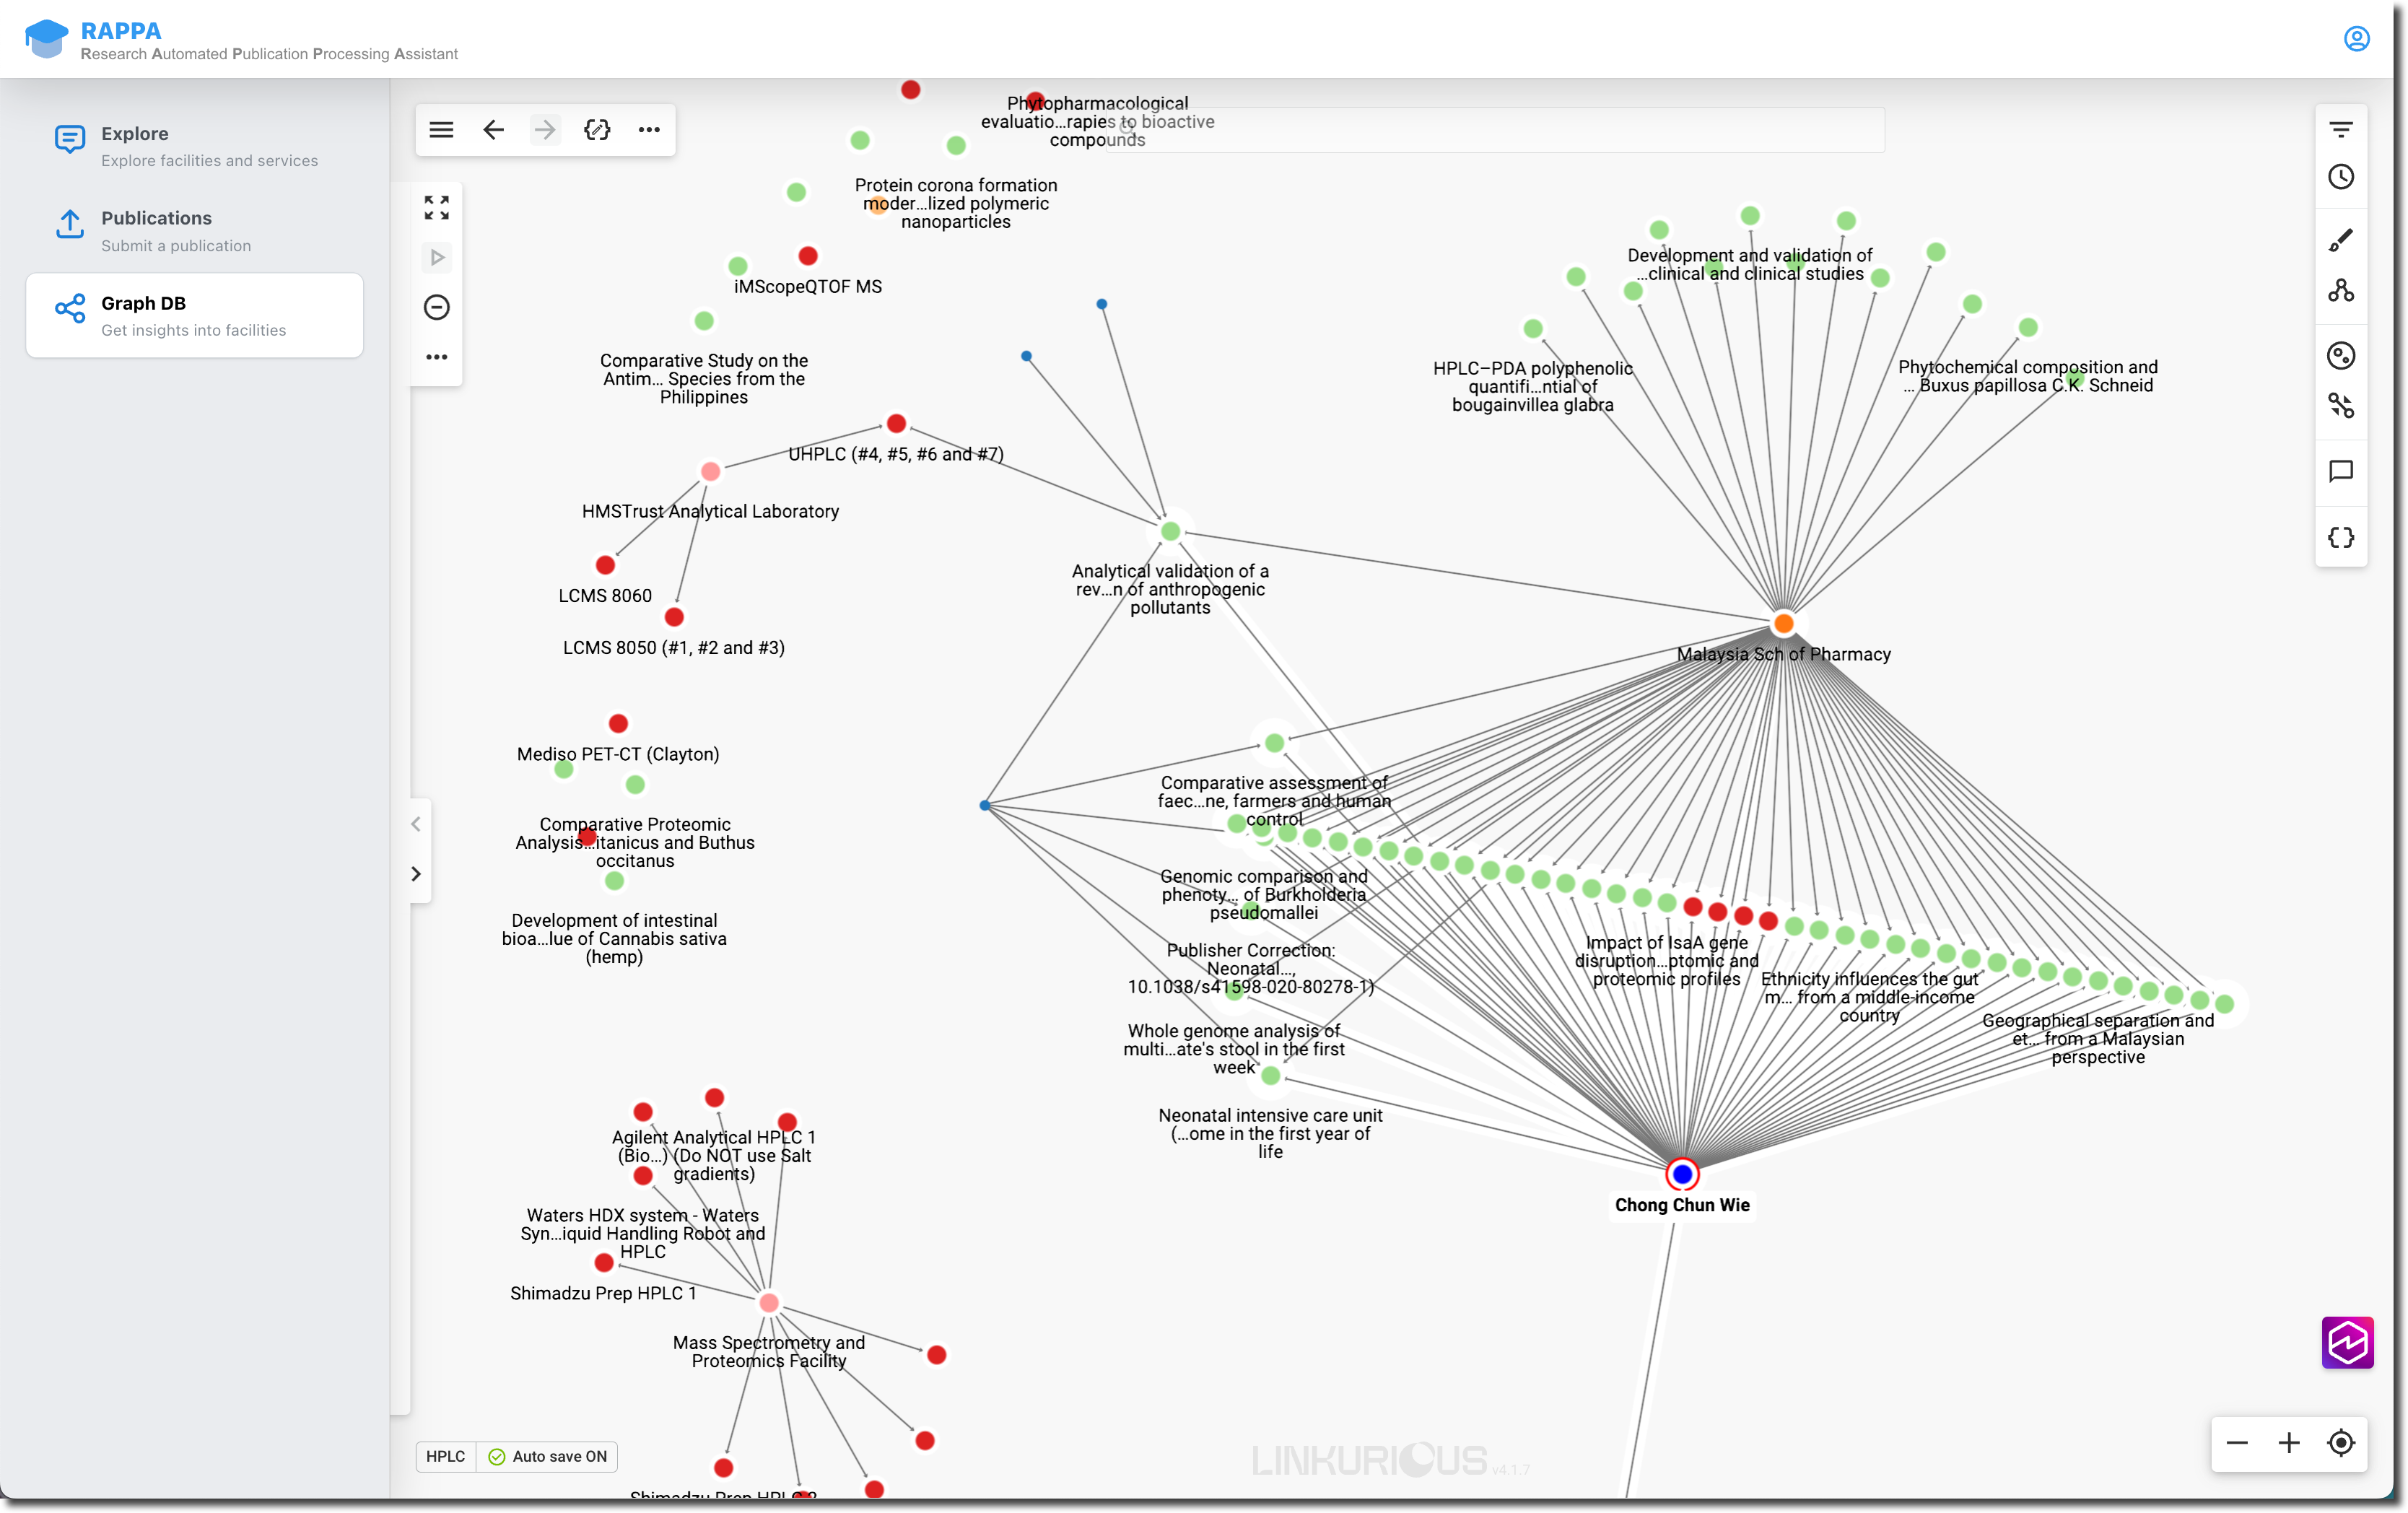
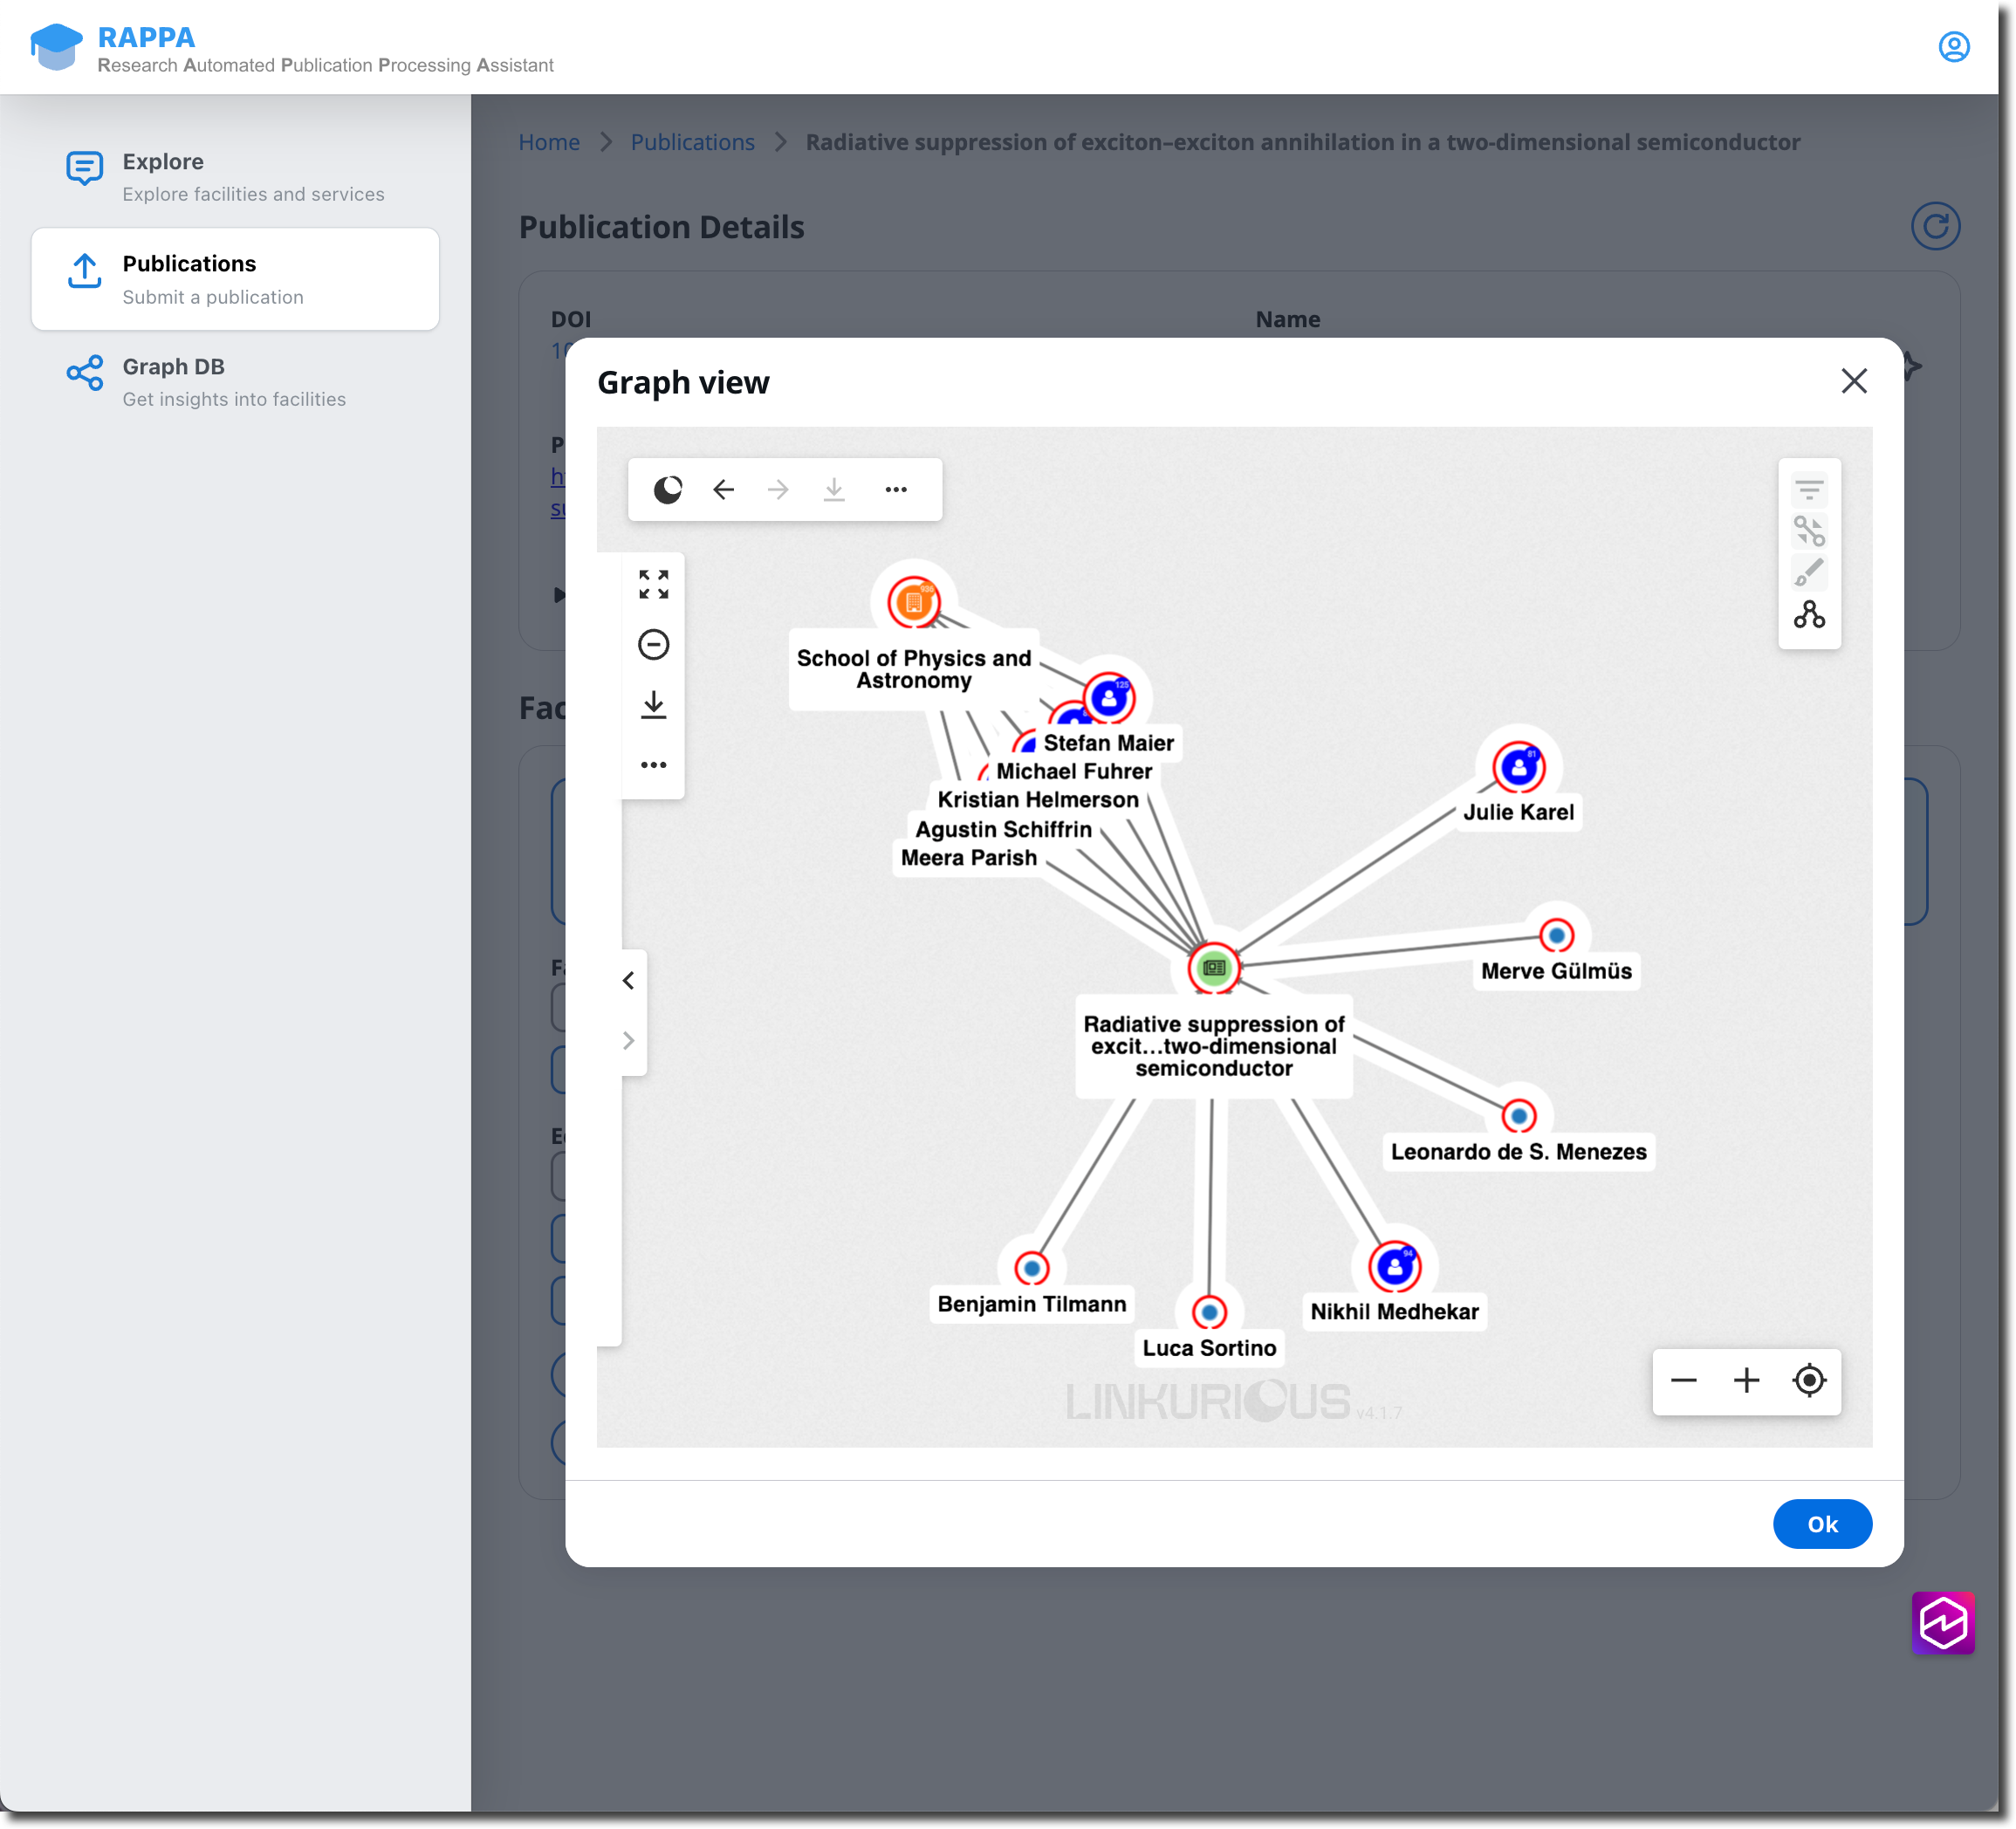
For example, you might search for the research technique UHPLC (ultra-high-performance liquid chromatography). RAPPA will display results of equipment used in research related to UHPLC, related research papers, and researchers working with the technique. In one click, you can open all this information as a graph visualization, expanding the nodes to see what’s most interesting for you. This creates a complete picture for executives, showing who is using the university’s UHPLC instruments, and what the output of that research has been.
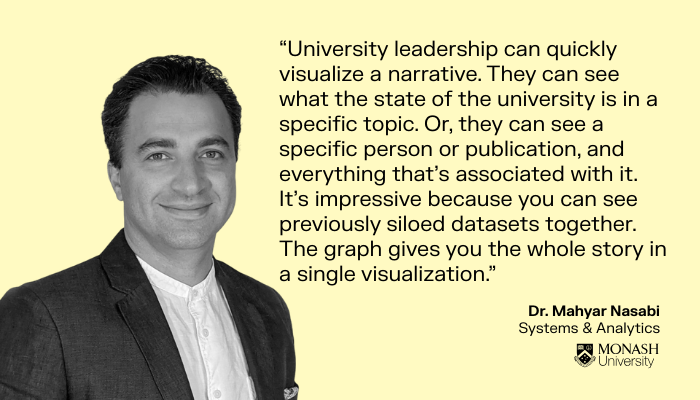
“University leadership can quickly visualize a narrative,” says Dr. Nasabi. “They can see what the state of the university is in a specific topic. Or, they can see a specific person or publication, and everything that’s associated with it. It’s impressive because you can see previously siloed datasets together. The graph gives you the whole story in a single visualization.”
RAPPA is powered by several technology components working together. Amazon Bedrock powers the LLM that acts as the primary interface for users. The team has given the LLM a curated knowledge base to work with, which is cross-referenced with the university database. This limits hallucinations. The team also keeps a human in the loop who verifies new information in the knowledge base and helps identify exactly which machine was used in each research paper.
Using Amazon Neptune, AWS’s graph database, the team has also built a knowledge graph containing data related to the full research landscape at Monash University. “Building the database is easy because Neptune doesn’t have a specific schema and you can add things on the fly,” says Philippe Gabert, a Solutions Architect at AWS who works hand in hand with the Systems & Analytics team at Monash.
On the front end, Linkurious Enterprise, Linkurious’ off-the-shelf graph visualization and analytics software, enables users to intuitively explore and interact with the knowledge graph.
Dr. Nasabi and his team chose to work with AWS technology for the project because it is cloud-native and LLM-native. AWS was also able to put together an enterprise-level system in little time. “Over the course of a two-day hackathon, as a team of five or six, we were able to build the whole concept and get it working,” says Philippe Gabert. “This says a lot about the agility of AWS technology.”
Linkurious Enterprise graph visualization and analytics software acts as a portal for users into the knowledge graph. It allows them to visualize entire networks of information related to specific points of interest. “Linkurious brings the ‘wow’ effect,” says Philippe. “When I show RAPPA to other customers or at public events, people find it amazing to be able to see their data on the fly, and to see how it’s related.”
Although the tool was developed primarily for university administrators to gain a full understanding of their research investments and their impact, RAPPA has proven extremely useful for other stakeholders in the university system. It acts as a practical information hub for researchers and students. Researchers and industry leaders can use it to ask questions in natural language, such as what equipment is available to them at the university.
Students can use it to find additional supervisors or learn who they might seek out for research help or advice. Using the graph in RAPPA, they can quickly access an overview of who is working on their topic of interest at Monash, and in the same graph see exactly what they have published.
“We see that RAPPA has opened a whole door to the university. LLMs can answer any questions using the knowledge base. This is common in technology innovation: you see the possibilities and can expand that innovation to other projects,” says Dr. Nasabi.
The solution has proven efficient in what it was built to do. The team replicated the exercise undertaken by the research performance team to analyze hundreds of papers published by university researchers. What took 15 people two weeks to accomplish was completed in hours by RAPPA.
The team behind RAPPA is currently presenting their proof of concept to the administration at Monash University, as well as to other universities in Australia. The most common feedback they receive is that the tool is an impressive solution to a problem virtually all universities struggle with. “Anyone who sees this says, that’s it, this is the solution,” says Dr. Nasabi. Part of the positive reception to their project is the innovative use of new technologies, he says. “This solution was not possible five years ago.”
The team also considers it a success that RAPPA has found applications beyond the initial project scope of calculating research ROI. “The beauty of RAPPA is that we’ve started from a project brief, and the project answered those questions and needs. And it has turned into a much bigger project, since it has the capacity to solve bigger problems, like enabling researchers and PhD students to easily identify research resources and make connections across the university,” says Dr. Nasabi.
The team plans to continue developing the project to make it a publicly accessible resource for everyone at Monash University, from administrators determining the value of research investments to the researchers of tomorrow seeking out the best expertise and equipment for the next big discovery.
We hosted a joint webinar with Monash University and AWS. Watch the replay to see RAPPA in action and to understand in greater depth how the project has come together and evolved.
A spotlight on graph technology directly in your inbox.