How Obsalytics mapped the Syrian regime’s connections and financial flows with Linkurious Enterprise
The war in Syria is now a decade old. In those ten years, more than half a million people have been killed or gone missing according to the Syrian Observatory for Human Rights. 55% of the total Syrian population has been uprooted from their homes. The full humanitarian toll of the conflict is almost immeasurable.
Truly understanding power structures and financial flows can be an important step in enabling change. But gaining in-depth understanding is difficult when you’re investigating a regime that often operates in obscurity.
Obsalytics is a non-profit based in Canada with collaborators around the world. Incorporated as an NGO in 2020, the team behind the organization has been working together since 2017. From day one, the mission of Obsalytics has been to bring the crooked activities of corrupt governments to light.
Obsalytics also started working with Linkurious in 2017. Their first project focused on mapping the networks of influence between Egyptian military generals and businessmen, showing conflicts of interest and a systematic exploitation of the Egyptian economy favoring the ruling elites.
Now, the team is shedding light on the Syrian regime. Using open-source data, their objective is to understand the main power structures and financial flows in Syria and democratize that information by making it available for the general public, the media, and researchers. Their aim is also to envision the eventual reconstruction of Syria, when businessmen close to the regime and the militias that helped repress uprisings are likely to be rewarded. Obsalytics makes it their mission to expose those networks ahead of time to shed light on shady connections and money flows.
For this project, Obsalytics needed an end-to-end solution for the entire research process, from data entry to visual exploration to running analytical queries. They also needed a solution that would offer easy integration with Neo4j graph database, supporting multiple data sources. Finally, they also needed support for Arabic text, since much of their data is in Arabic.
Linkurious Enterprise investigation platform checked all the boxes. “It’s the go-to tool for this kind of complex problem, for the kind of challenges we face… It was a no-brainer for us,” says Wael Alalwani, co-founder of Obsalytics. The non-profit organization was also able to benefit from the Linkurious for Good program.
Linkurious Enterprise has enabled them to analyze and explore business networks, blood ties, networks of influence, and sanctions evasions. Through graph visualization, they are able to follow transactions to make sense of these connections and understand when someone is bypassing sanctions, for example, through family members, shell companies, or by other means.
One of Obsalytics’ other major projects was mapping the entire family tree of Bashar al Assad. They are the first organization to have produced a complete map, which is now available to researchers, legal actors, and others. One of the benefits of doing this with Linkurious Enterprise is that the information is fast-loading and easy to share.
The graph technology behind Linkurious Enterprise also makes it easy for Obsalytics to look for missing information. “We’re using Linkurious to help throughout the whole cycle, even the data collection. Sometimes when you see the information visually, you realize that there are some areas you might have missed and that you should investigate,” says Wael Alalwani. When they do find missing information, “Linkurious helps us see the position of person within the network. It drives us to ask more questions and do additional investigation. Most of these cases turn out to be very interesting.”
Two features in Linkurious Enterprise have been particularly helpful for Obsalytics to gain a more complete understanding of their data.
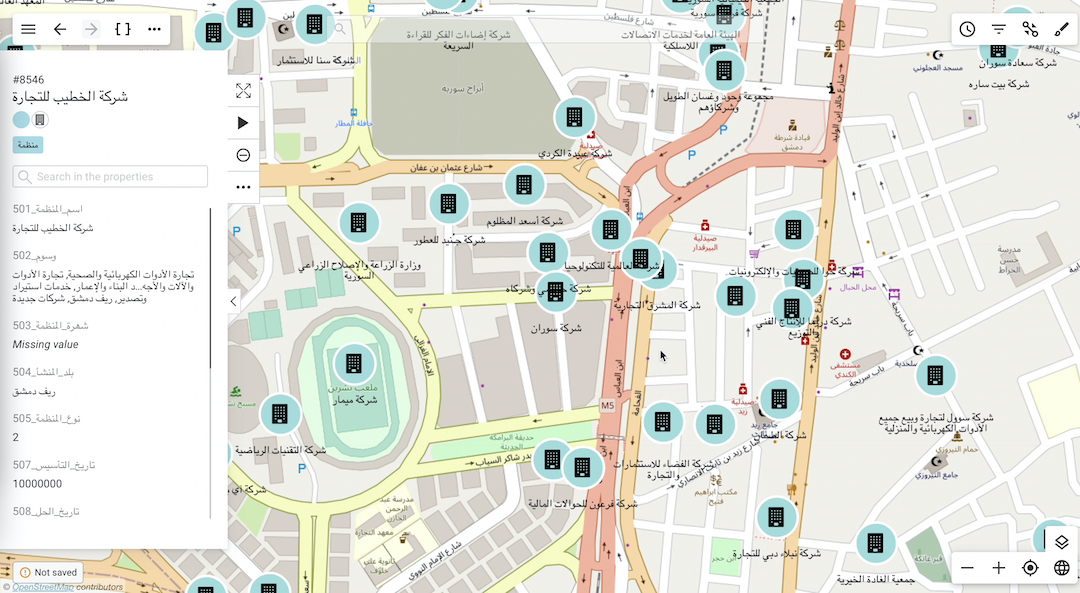
In some of the data the team is working on, geographic location is a key element. But visualizing connected data alongside geographic information can be challenging without the right tool for the job. Using geo mode in Linkurious Enterprise, nodes and relationships appear on a map, making geographic data easier to understand.
Geo mode has enabled the team to map out Syrian companies alongside the addresses of businesses sanctioned by the EU/US to spot sanctions evasions. Geo mode has also been especially useful to map the secretive and brutal security apparatus of the Syrian regime, demonstrating their network of coordination. “We are in discussions with a Syrian NGO that works on defending human rights that seeked out our help in plotting the chain of commands in the networks and organizations involved in violations and massacres,” says Wael Alalwani. “It helps them in focusing their efforts, analyzing the shared responsibilities of perpetrators, and building a compelling case against those perpetrators.”

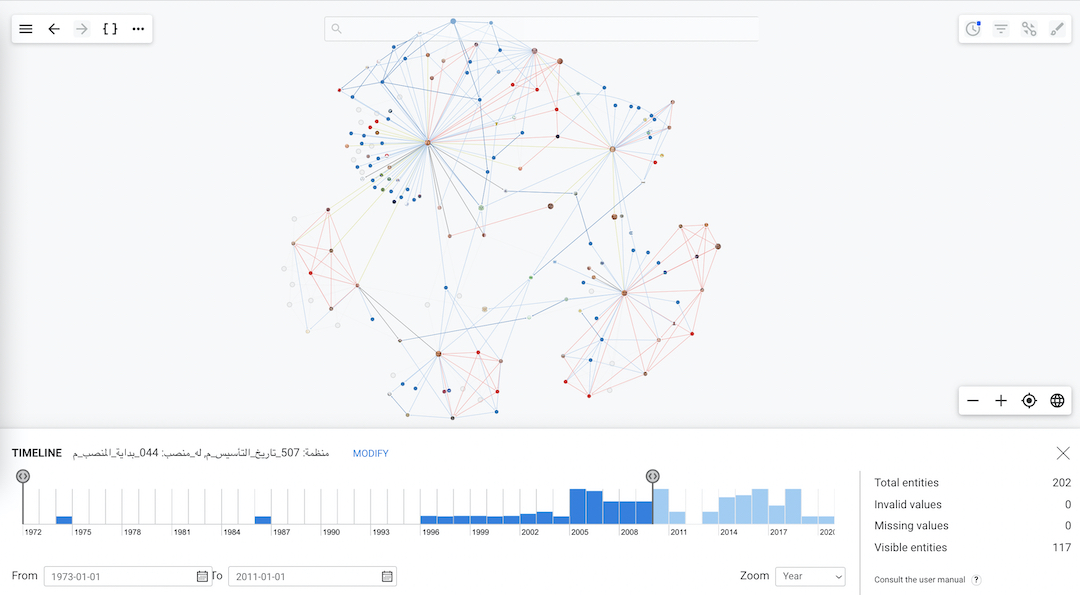
The Linkurious Enterprise timeline feature has also proven useful. The timeline displays the distribution of values of one or multiple properties at once, over a given period of time. Being able to filter and visualize their data over time has enabled Obsalytics to see how networks and industries, like the oil and gas industry, have evolved over time. The timeline has also been useful to track changes in alliances among opposition networks, regime-backed militia, and Iran- and Russia-backed militia. “A network is worth pages of research,” on the subject, says Wael Alalwani.

The aim of Obsalytics’ project is to make crucial information available to whoever needs it. They work with several different audiences, all of whom benefit from being able to independently explore graph data.
Researchers & policymakers. Imposing sanctions can disproportionately affect the Syrian population. Obsalytics’ research can help understand the impact any new legislation or policy might have.
Media. With investigative journalism growing in popularity in the Arab world, Obsalytics has been working with several journalists, including reporters from Al Jazeera. They use the data and information made available to them to investigate their stories.
Legal actors. They are in contact with two organizations trying to bring the Syrian regime to court to hold it accountable. When these organizations need information to back up accusations, they can turn to the data Obsalytics has made available.
Private sector. Finally, the NGO provides assistance to private companies who might contribute to the reconstruction of Syria, helping them to make better business decisions. Understanding exactly who they are doing business with and who they are connected to is essential in the current context.
That Linkurious Enterprise makes it easy and intuitive to explore large amounts of data helps Obsalytics bring information to so many different audiences. “There’s no training necessary” for their partners to be able to explore the data on their own, says Wael Alalwani. “It wouldn’t be possible to promote the project in the same way without Linkurious.”

The collaborative aspect of Linkurious Enterprise is also essential to their way of working. Instead of sharing images or PDFs, they can give researchers direct access to graph visualizations. This facilitates the sharing of information and makes it easier to rely on collective intelligence to advance the goals of Obsalytics.
Finally, customization has enabled Obsalytics to adapt their graph visualizations according to their needs. They have been able to add photos of people to the nodes concerning them, for example, making the graphs easier to understand at a glance. They can also tailor their data to their needs; rather than being stuck with one way of processing information, Linkurious Enterprise affords Obsalytics flexibility.
A spotlight on graph technology directly in your inbox.


