Have you ever had your credit card stolen? It is not an uncommon situation. If it happens to you and you’re lucky, your bank will end up paying for the operations made with the credit card. But what happens behind the scene? Do criminals get caught? In this post, we see how graph technology like Linkurious and Neo4j help investigators identify and investigate credit card fraud schemes.
With almost 3 millions consumers complaints in 2017 in the US, it is now a pretty common scenario in which an ill-intentioned person gets a hold of a credit card information and proceeds to empty the account it is attached to. For fraud analysts, it is essential to reduce the detection time of these situations, which can lead to serious financial losses for the organizations.
As often, to fight back against criminals, it is important to understand how they operate.
Personal data breaches occur more and more frequently, meaning that the opportunities for hackers to get their hands on credit cards data are numerous. The fraudster might have bought the stolen card numbers from a dubious website, or simply got the card details through the use of an ATM or gas pump skimmer.
Early October 2018, the Sheriff’s Office of a Californian town found five credit card skimmers at two gas stations. They identified more than a dozen cases of credit card theft, accounting for 20,000$. Thieves had created fake credit cards encoded with customer stolen information. They had used them to buy multiple, low value, gift cards at different supermarket knowing that banks typically do not get suspicious over low-value transactions at grocery stores.
What led the police to unveil the fraud was that for all the stolen credit cards cases they investigated, there was something in common. At a point in time, the victims had used their credit card to fill their car tank at the gas stations. From there, the police was able to identify the criminals and arrest them.
Perhaps when reading this story, you begin to understand what stolen credit cards and graphs have in common. In the rest of this article, we put ourselves in the shoes of a credit card company seeking to detect fraud.
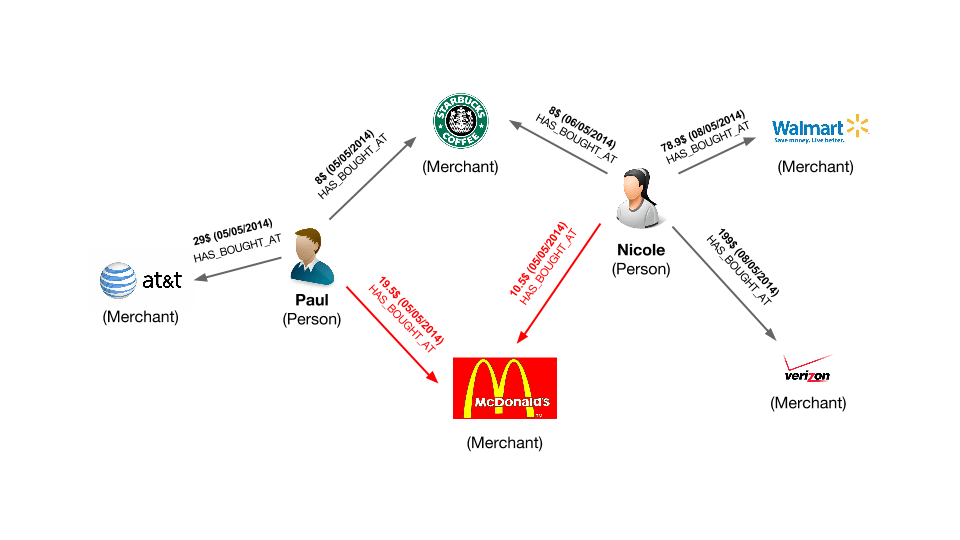
We are going to see why graph technology can help us with fraud detection. If someone steals one of our customer’s credit card, chances are that we’ll have to refund the fraudulent purchases made by the criminal. We, therefore, want to catch the criminal as fast as possible and deny him the ability to make purchases. What kind of information do we have to identify quickly the fraudsters? We know about customers, who use their credit cards, and about transactions done with merchants.

This is a graph. Customers are connected through transactions to merchants. Most transactions are legitimate but some are contested by our customers. Representing the transaction history as a graph is going to allow us to zoom in on the merchants repeatedly involved in the fraudulent transactions. It’s probable that at one of these stores, a criminal is stealing credit card numbers from the customers. The data model that we have built is the first step to expose him.
We created a small dataset based on the data model above. It consists of a series of transactions: some of them have been made by a criminal who stole credit card information. We are going to use Linkurious Enterprise to identify him.
You can download the data from here.
Below are the transactions flagged as fraudulent :
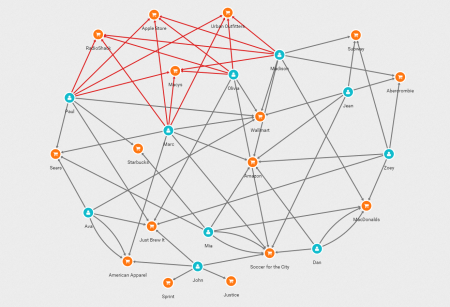
Can you identify the patterns in this list? It is rather difficult to understand what is going on simply by looking at this table. What we want to know is how the transactions connect people with merchants. Tables are not very good at displaying the connections in the data. In order to do that we must turn to graphs. Below, is the same data sample represented as a graph in Linkurious Enterprise.

In blue are our customers and in orange our merchants. The edges connecting them represent the transactions. We colored in red the transactions with a status “disputed” in their properties. It’s already way simpler to understand the situation. We’ve four customers with fraudulent transactions made in the four same shops.
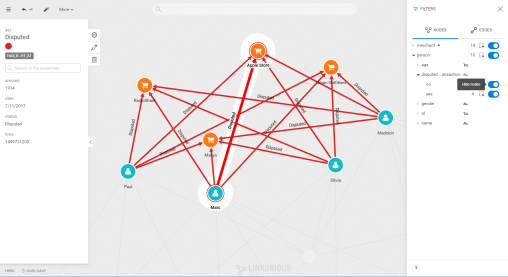
We can use property-based filters to take a look at the victims and merchants involved in our fraud case.

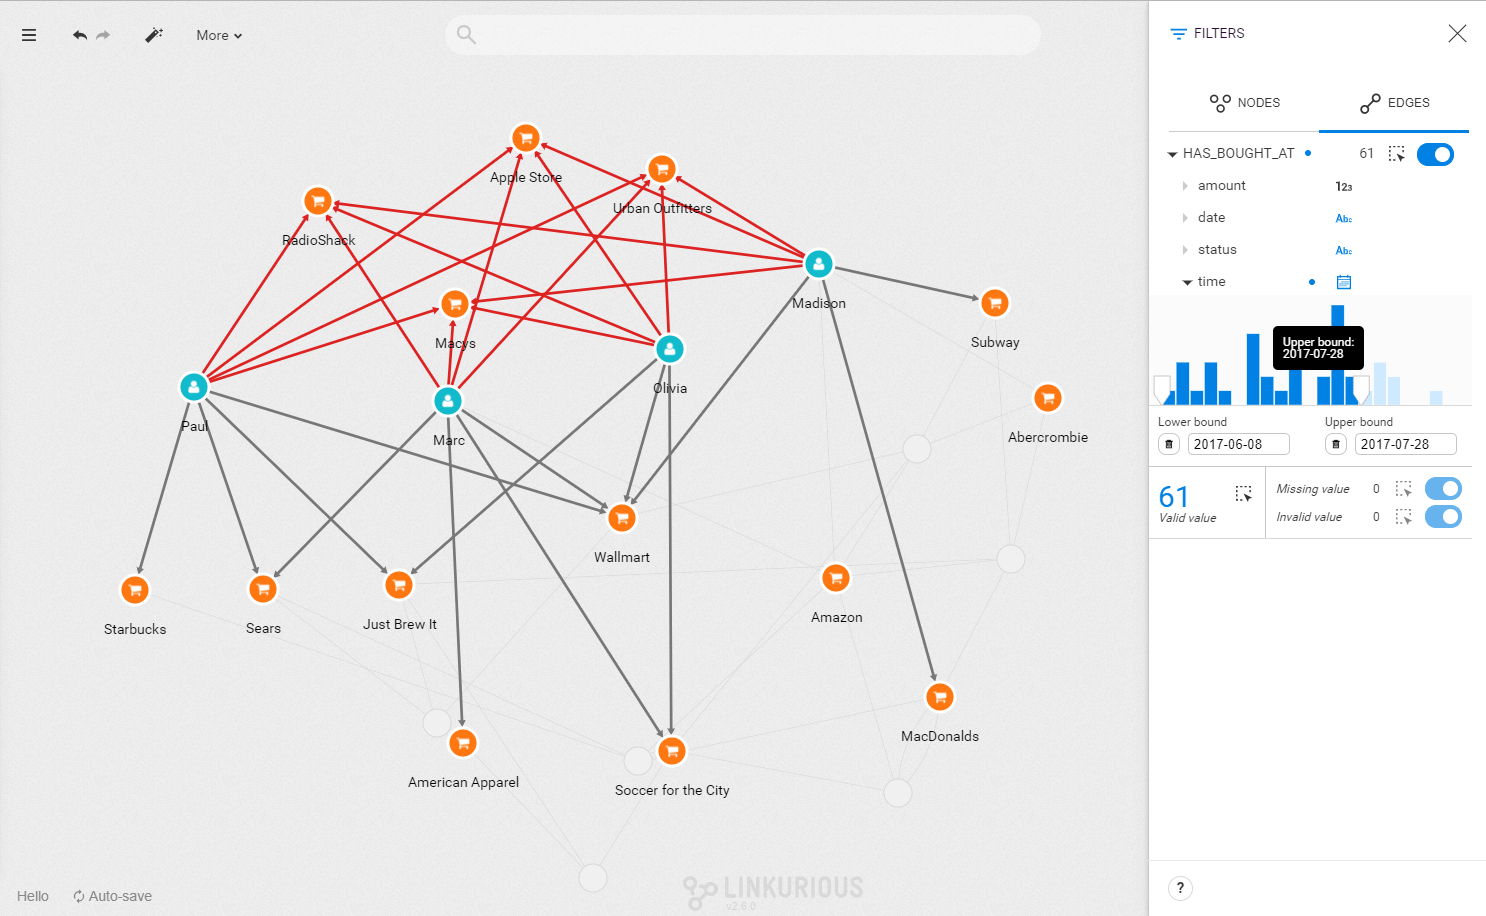
But where is the criminal we are looking for? What’s going to help us here is the transaction date on each fraudulent transaction. Our fraudster is involved in a legitimate transaction during which he captures his victim’s credit card numbers. He then executes his illegitimate transactions. That means that we do not only want the illegitimate transactions but also the transactions happening before the theft. The time-filtering capability of Linkurious Enterprise allows us to display the transactions taking place in a specific time range.

Now we want to find the common point of compromise: is there a common merchant in all of these seemingly innocuous transactions? We can investigate visually or we can use a Cypher query to find that merchant. Below, we use the template of a query available to all users to identify it in a click.

It seems that each time a fraudulent transaction has occurred in the days leading to it, the credit card user has visited Walmart. We know the place and the moment when the customer’s credit cards numbers were stolen. We can alert the authorities and the merchant on the situation.
Credit card fraud, and other fraud detection scenarios, involve sorting through large volumes of data to find suspicious links. That type of problem is where graph databases like Neo4j are very helpful. By storing the data as a graph, we can highlight the connections within the data. Graph platform like Linkurious Enterprise allows to quickly filter out the noise, identify the suspicious pattern and target the origin of the fraud.
A spotlight on graph technology directly in your inbox.

