Make sound decisions with context and speed at hand
Uncover key insights with the full context around entities, connections, and relationships within your data, ensuring every decision is backed by clarity and accuracy. Teams of technical and non-technical users alike can easily begin exploring their graph data at scale and collaborate with ease to get to the bottom of even the most complex analysisβall before lunch.
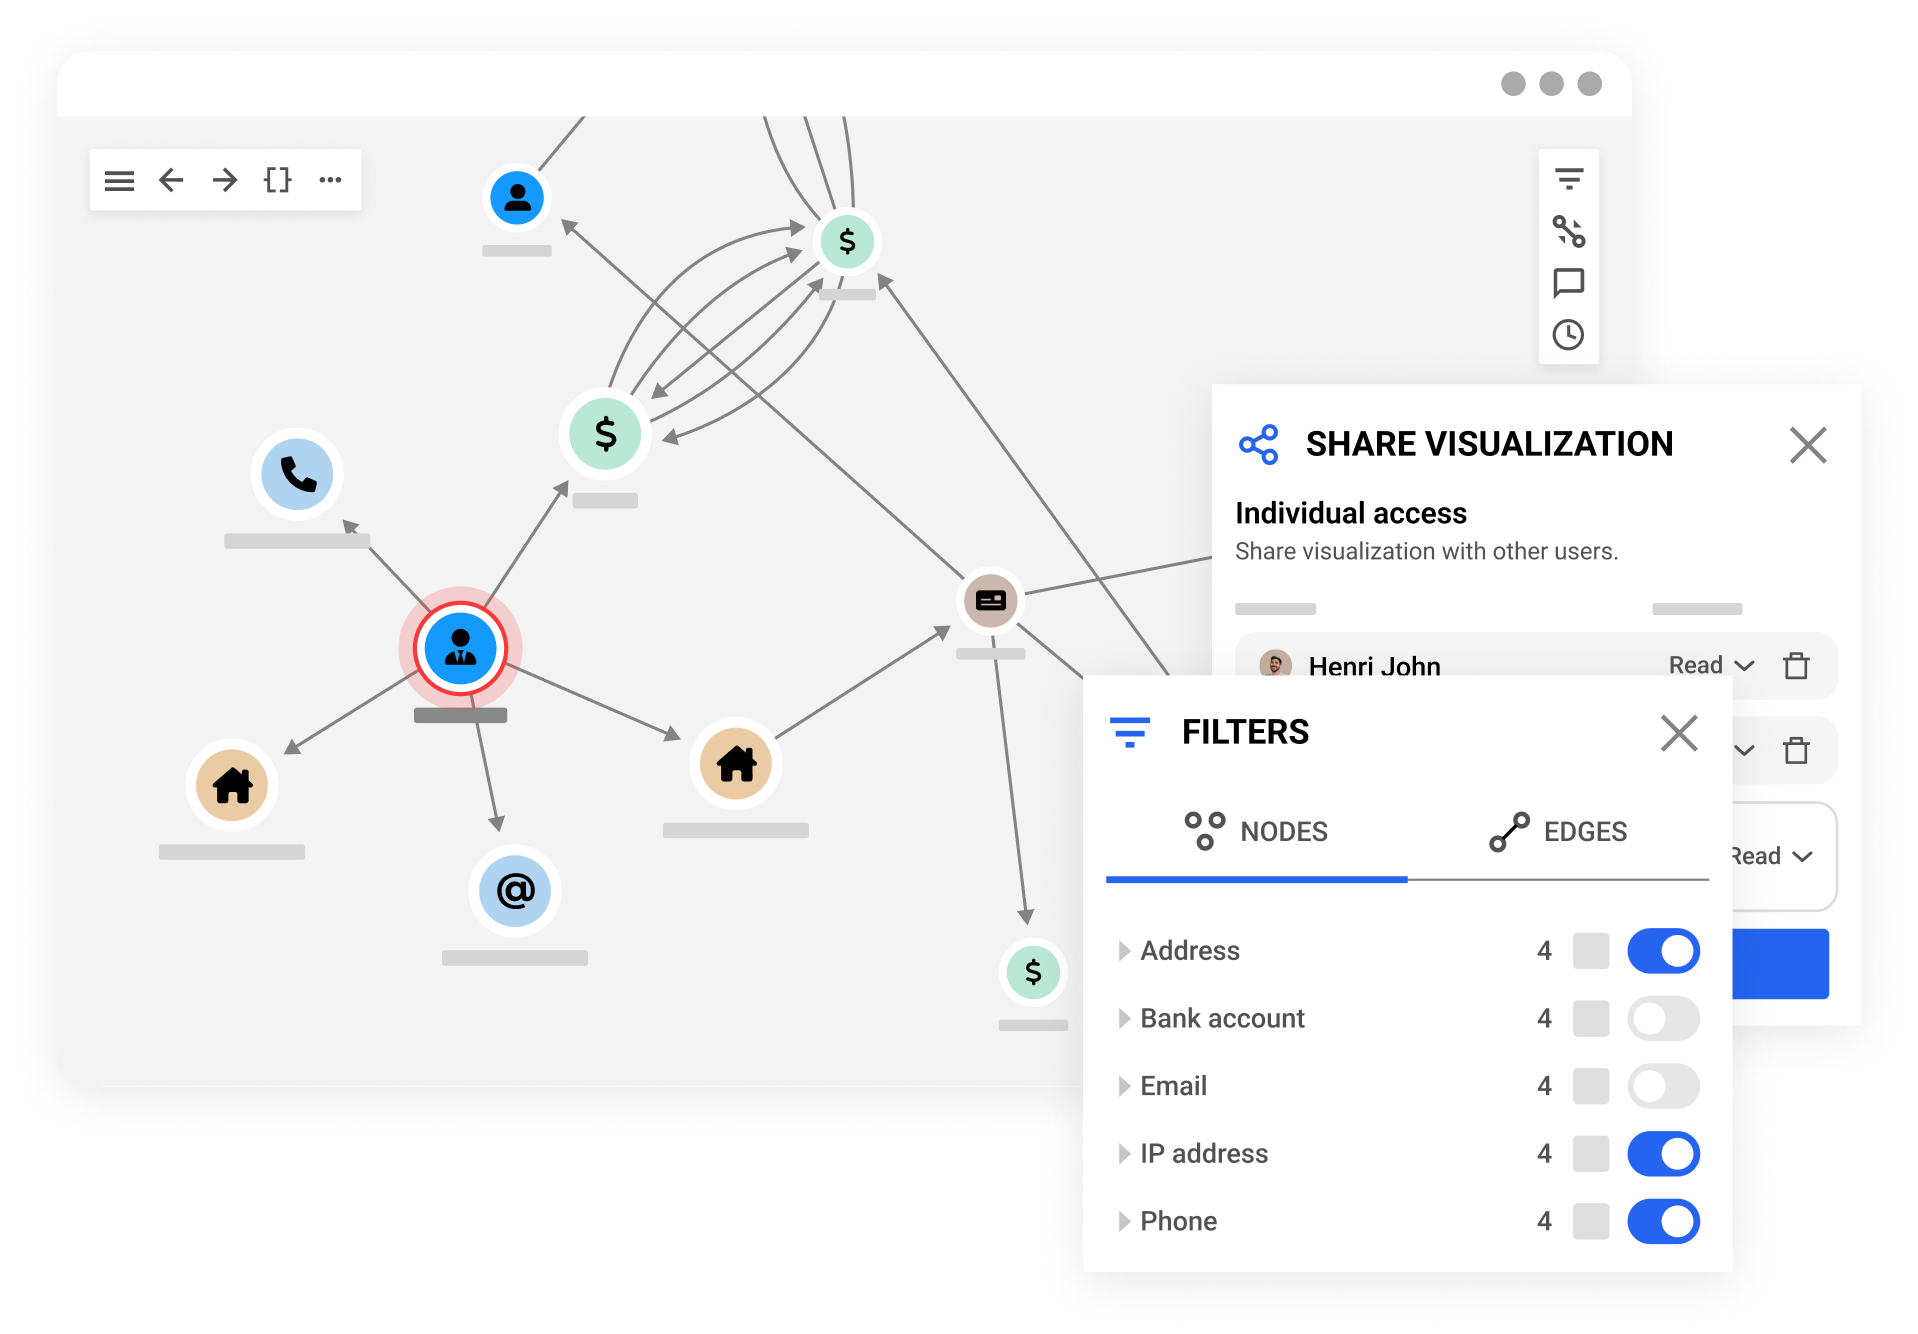
Quickly reveal hidden insights rooted in context
No matter how large or complex your connected data may be, with a feature-rich and user-friendly workspace designed for advanced graph visualization and analysis, youβre able to explore the full context around your data at a glance and cut through the noise in just minutes rather than hours.
Effortlessly search and query your data, instantly visualize graphs with up to 10,000 nodes, expand neighbors with a click, undo-redo actions, display networks on geographical maps, and save your results.
Quickly customize styles, filter out noise, navigate data over time, and simplify visualizations by grouping nodes with common properties.
Make augmented decisions
Empower your decision-making process by integrating and enriching diverse data sources. By incorporating OSINT or third-party data, you can enrich your data sources, uncover hidden patterns, and gain nuanced insights that drive more informed and strategic decisions.
Enrich companies and people in your graph using data from external data-vendor APIs.
Seamlessly pivot between Linkurious and your favorite applications to leverage insights beyond whatβs in your graph data.
Increase your teamβs productivity & efficiency
Streamline teamwork and ensure everyone stays aligned on mission-critical projects no matter their level of expertise. Increase your teamβs productivity with tools that simplify and accelerate data exploration.
Turn repetitive analysis steps into reusable buttons or forms that allow you to quickly execute complex queries directly from your visualization. Search or tag queries and attach them to nodes and edges for contextual actions in a single click.
Easily share visualizations and queries on the team or enterprise level. Comment on visualizations by tagging your colleagues to share insights.
Secure your data and comply with privacy policies with enterprise-level access rights that also apply to data and content created by users.
Why Linkurious
Cost efficient and transparent
Optimize your Total Cost of Ownership and better control your budget with transparent software licenses, support, and services as well as predictable costs for data, infrastructure, and build. Faster to deploy and simpler to support and maintain over time, our future-proof platform ensures cost efficiency and financial clarity for your business, today and tomorrow.
Native graph technology at our core
Graph technology has always been at the core of what we do and who we are. Linkuriousβ graph-powered platform allows you to quickly achieve unmatched results, capable of tackling even the most complex analyses with ease, regardless of the size or intricacy of your datasets.
A truly open platform
Our suite of connectors and APIs provide robust integration capabilities, allowing you to effortlessly connect with your existing systems. Ensure and maintain a unified and cohesive tech environment without the hassle.
Choose just what you need
Tailor our decision intelligence platform to your needs. Simply looking for a way to visualize your graph database or interested in an integrated decision intelligence solution? Our flexible system adapts with you, ensuring you always have the right tools at the right time.
Collaborative workspace
From the team to enterprise level, enhance productivity with a user-friendly and collaborative workspace. Multiple users can simultaneously see, share, and interact on their analyses or best practices, promoting smoother collaboration and collective decision-making.