Powerful and intuitive graph visualization, built for teams
Leverage powerful graph visualization features that are intuitive and easy-to-use. Providing your teams, no matter their level of expertise, with a deep understanding of the relationships and context within their graph data. Ultimately revealing insights that may have otherwise gone unnoticed.

Discover powerful new insights, faster
Swiftly and easily navigate complex connected data and accurately surface key insights at lightning speed.
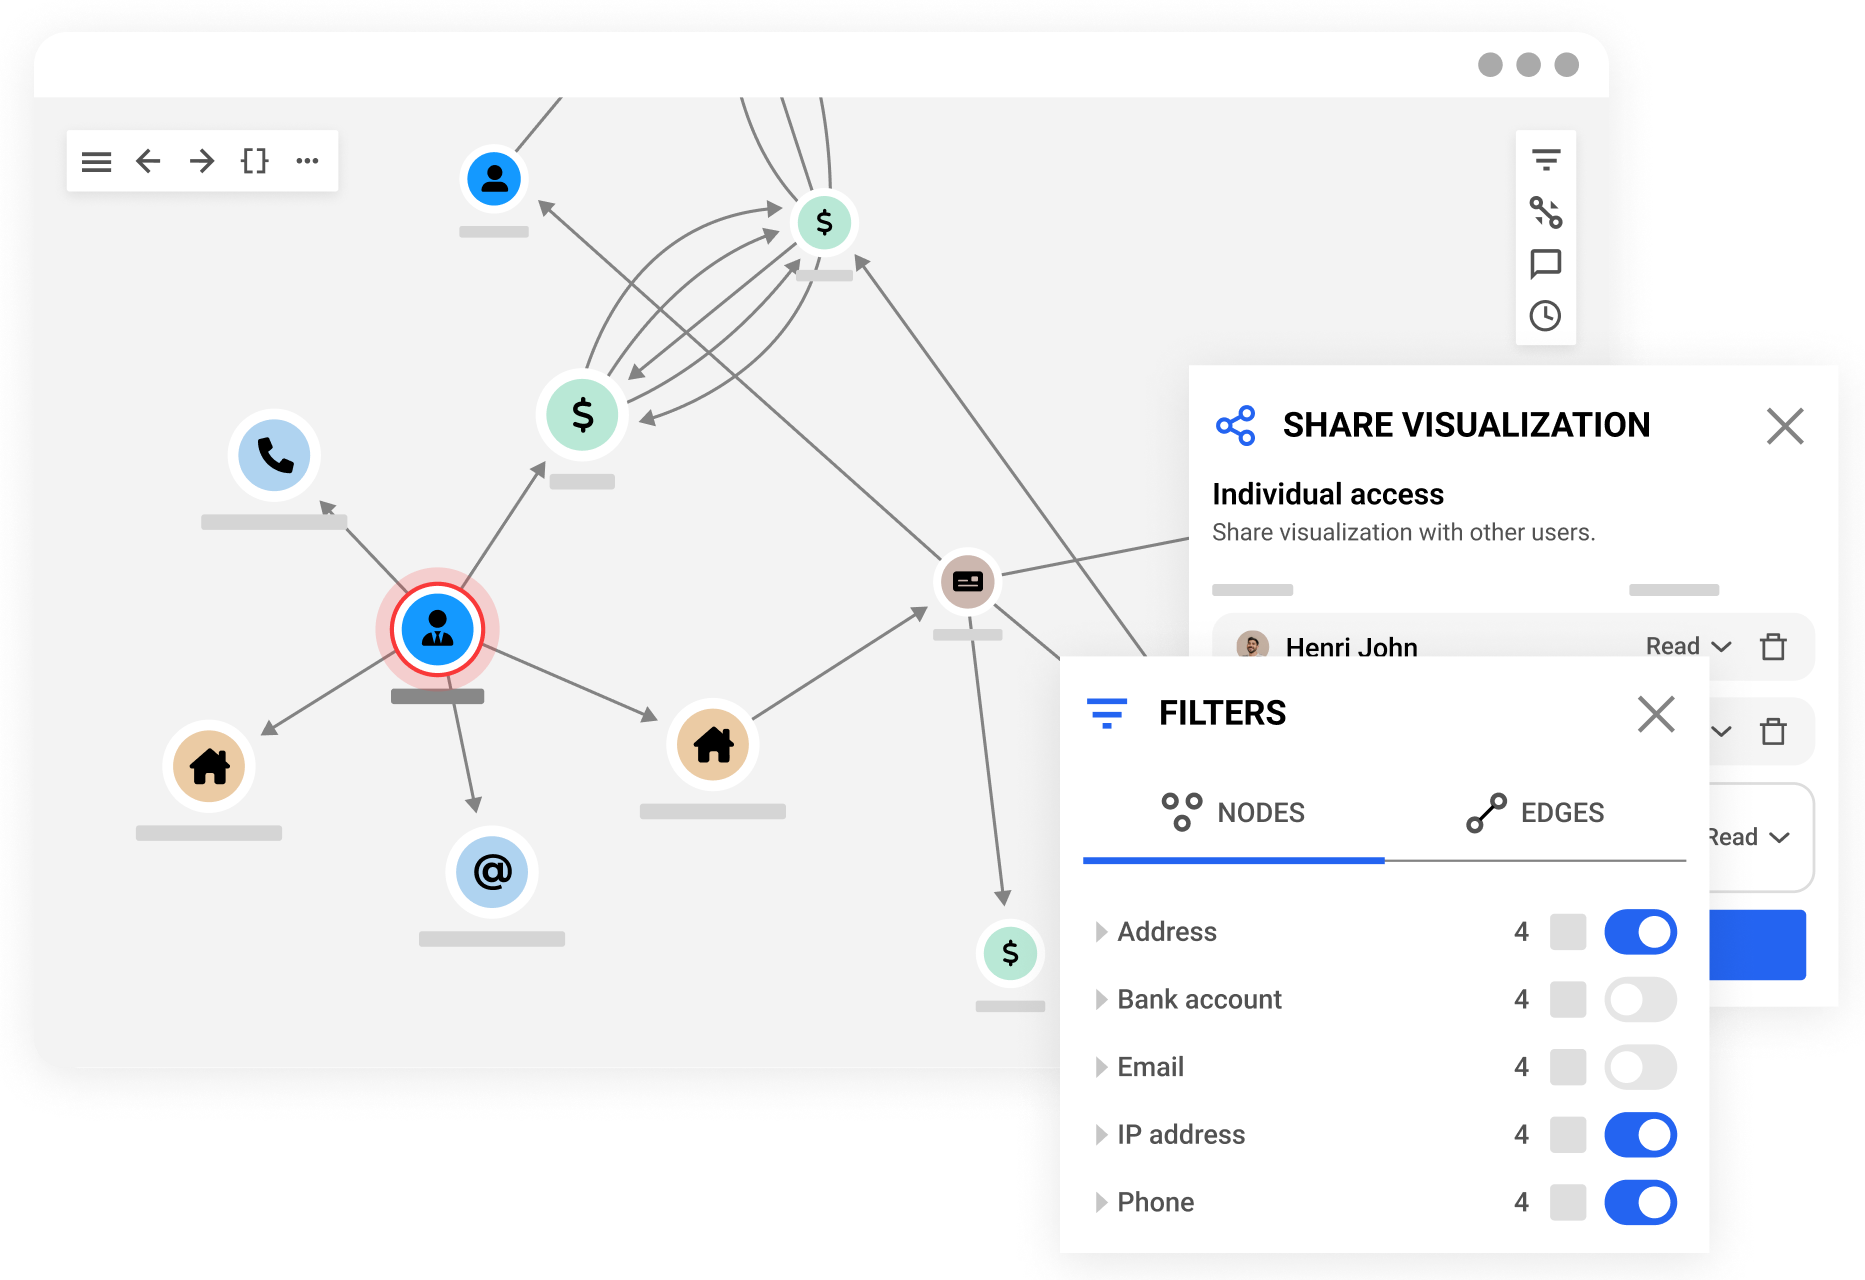
Intuitive graph visualizations at your fingertips
An intuitive and customizable interface that works the way you think to better facilitate your data exploration and adapt to your specific needs.
Increase your teams productivity and efficiency
Whether you're collaborating across your team, department, or on the enterprise level, ensuring the right people have access to the right assets is essential.
You may also like
Subscribe to our newsletter A spotlight on graph technology directly in your inbox.