They say it is lonely at the top. For the 450 board directors leading the biggest companies in France that is certainly not true. They form a small network in which a few key individual wield a big influence.
Even a CEO has to answer to someone. For the CEO of a big company, that someone is the board of directors. The “board” as it is often called, gathers members who oversee the activity of an organization. In a stock corporation, the board members are elected by the shareholders. The board members responsibilities vary from one company to the next but it often includes choosing and firing the CEO, signing off on the major business decisions.
Why talk about board rooms in a graph visualization blog? The CAC 40 is a French index composed of the 40 leading French companies. These companies are led by a small group of 450 board directors. A single director is typically linked to multiple companies. For example, Baudouin Prot, the CEO of BNP Paribas, is seating on the board of 4 CAC 40 companies.
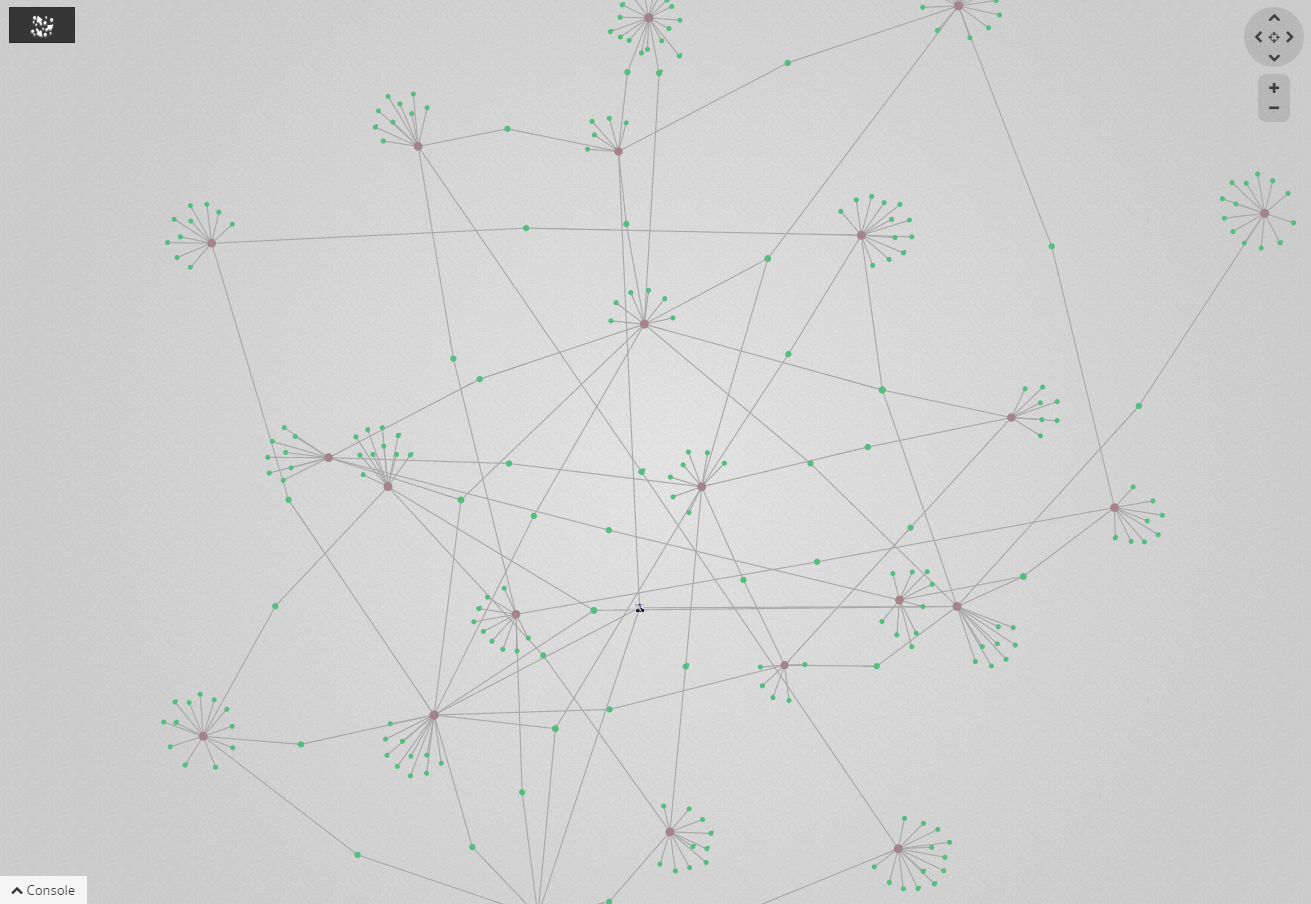
Through their multiple mandates and the people they sit together with, the CAC 40 board directors are linked to the most of the companies with the CAC 40. It creates a small yet powerful network.
To illustrate this, we are going to visualize the network of the CAC 40 board directors.
The boards of directors have been a subject of a few articles in the past including from Franck Ghitalla and l’Atelier Iceberg, Alternative Economiques or Mathieu Totet. A few scientific articles study interlocking directorate. For this article, I have prepared a dataset with the help of Guillaume Sylvestre. The data is directly accessible in a spreadsheet, I encourage you to use it and update it.
The spreadsheet contains 3 lists :
- the list of CAC companies ;
- the list of CAC 40 board members ;
- the list of connections between the board members and the companies ;
In our network, the companies and board members are nodes. They are connected together when a board member seats in the board of a company.
A spreadsheet may sound like the furthest thing from a graph. Fortunately we can turn the lines and columns in our spreadsheet in a graph via Cypher. Cypher is a query language for Neo4j, an open-source graph database. It can be used to create and store a graph.
I have saved the spreadsheet as 3 separate csv files. We are going to turn these files into a Neo4j graph.
First, let’s import the directors. In the Neo4j console, we simply have to type :
//load the directors
LOAD CSV WITH HEADERS FROM “https://gist.githubusercontent.com/jvilledieu/f8ee20dae15d70ed5745/raw/4d8e9950f3300bfd9824327b4b7043ac19493084/directors_cac40.csv” AS csvLine
CREATE (p:Person {id: csvLine.id, name: csvLine.name, surname: csvLine.surname, birth_date: csvLine.birth_date, nationality: csvLine.nationality, birthplace: csvLine.birthplace, sex: csvLine.sex, school: csvLine.school, picture: csvLine.picture, biography: csvLine.biography})
And finally the relationships between them :
//load relationships
LOAD CSV WITH HEADERS FROM “https://gist.githubusercontent.com/jvilledieu/ccddf3eb7d3f7ef4567c/raw/ec74ffd7931bc1144d3c45053453df40bf6a56d6/edges_cac40” AS line
MATCH (p:Person {id:line.from})
MERGE (c:Company {id:line.to})
CREATE (p)-[:IS_DIRECTOR_OF]->(c)
These 3 queries turn our tabular data into a graph of nodes and edges.
Now that the data has been imported into Neo4j, we can visualize it with Linkurious.
The network has one single component. This means that any CAC 40 board director is just a few hops away from any of his counterpart. For example Baudouin Prot has a seat in 4 companies (BNP Paribas, Véolia Environnement, Lafarge SA and Kering). Through his mandates, he is working closely with 52 other board members. In turn, via these board members he is connected to 197 other board members.
As our data is stored in Neo4j, we can use Cypher its query language to analyse the data. Rik van Bruggen has written on SNA and Cypher and we are going to use his awesome work. Let’s try to determine who is the most influential board director in France for example.
One way to answer that question is to use calculate the degree centrality for the persons in our network. To do it, we are going to count the number of connections or “degree” of each board director. To do it, type in the Neo4j column :
match n-[r]->m
return n.name as persons, count(r) as DegreeScore
order by DegreeScore desc limit 10
Here is the result for the CAC 40 :
To understand why Baudouin Prot is so influential, we only have to look at the data. Mr Prot has a seat in 4 companies (BNP Paribas, Véolia Environnement, Lafarge SA and Kering). Through his mandates, he is working closely with 52 other board members.
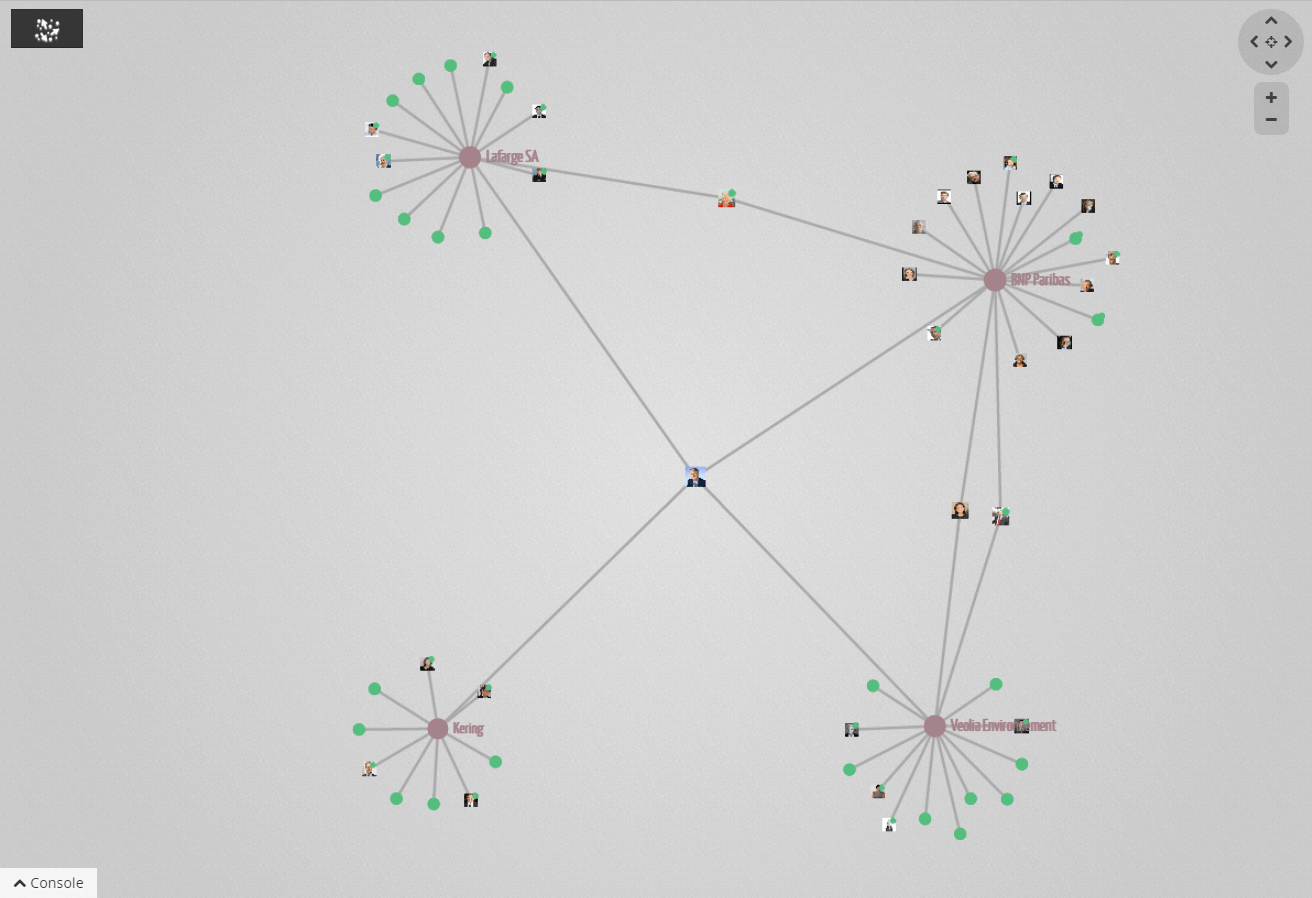
Baudouin Prot’s contacts have their own network. Michel Pébereau for example is connected to 2 other companies (Airbus and Total). Collectively, Baudouin Prot’s contacts are connected to 18 companies and 197 other board members.
An other way to estimate who is the most influential board director is to calculate the betweenness centrality. According to Wikipedia, “betweenness centrality is an indicator of a node’s centrality in a network. It is equal to the number of shortest paths from all vertices to all others that pass through that node”. Here is how to calculate it :
MATCH p=allShortestPaths((source:Person)-[*]-(target:Person))
WHERE id(source) < id(target) and length(p) > 1
UNWIND nodes(p)[1..-1] as n
RETURN n.name, n.surname, count(*) as betweenness
ORDER BY betweenness DESC
Here is the result for the CAC 40 :
No matter which indicator we choose, it is clear that not all CAC 40’s board members are equal. A little group sits in multiple board and has a big influence. Their decisions impact some of the biggest companies in the world. At the other end of the spectrum, there are board members who are tied to only one company. They have a (relatively) lower influence, mostly limited to their company.
The CAC 40 is an interesting example. Intuitively, we may imagine it only as a collection of separated companies. But when we look at the board members of these companies, a network emerges. The people who are directing the CAC 40 companies form a small community. This certainly facilitate the flow of information and the alliances. For example, if Véolia and BNP wants to discuss a partnership they can do so through both Marion Guillou or Pierre-André de Chalendar. They are both seating on the boards of the 2 firms. Of course that may also lead to potential conflicts of interests.
We have only scratched the surface of the CAC 40 network. We could for example look for the connections between the women within the boardrooms. We could study the importance of the French elite schools in the CAC 40 or the importance of French nationals vs other nationalities. In order to do that we need more data and you can help us!
The complete CAC 40 dataset is available here. You can edit, remove or edit the data.
The list of board members is complete as of October 8th. You can help us by providing in the appropriate columns more information (schools attended, date of birth, nationality, sex, etc) about the individual members. With your help we will be able soon to find more subtle connections in the CAC 40 network!
A spotlight on graph technology directly in your inbox.