Critical Threats Project delivers timely, actionable intelligence with Linkurious
The 20-person team of the Critical Threats Project at the American Enterprise Institute had to analyze multiple intelligence data sources to generate insights about networks of people and events to understand threats to US national security.
They decided to use Linkurious Enterprise to piece together intelligent pictures of conflict dynamics, understand threats, and share recommendations.

The American Enterprise Institute (AEI) is a world-class public policy think tank founded in 1938 and dedicated to defending human dignity, expanding human potential, and building a freer and safer world. Its policy areas include foreign and defense, economics, health care, and education.
In 2009, AEI created the Critical Threats Project (CTP). The goal of this project is to highlight the complexity of the global challenges the United States faces with a primary focus on the threats posed by Iran and the global al Qaeda network.
Within the project, a team of 20 analysts and support operators conduct intelligence analysis on open source intelligence (OSINT) data. They produce influential assessments, forecasts, and policy recommendations to inform and educate policymakers, the intelligence and military communities, and all interested citizens.
Unlike the conventional intelligence-gathering model, CTP analysts both collect and analyze the data, reducing the delay and the misinterpretation risk associated when collection and analysis are separated. On a daily basis, they gather data from publicly available sources, such as local and international media, social media posts, and public reports, and ingest them into their database system. However, without the appropriate technology, the CTP team couldn’t take advantage of their intelligence model.
"What we have found repeatedly is that if you are ingesting new entities and linking them together, visualization is essential," explained Frederick W. Kagan, director of CTP. "The solutions we experimented with were not well-designed for continuously updating data, requiring additional workflow steps when analysts were to update the data."
At the same time, the process of insight generation is extremely complex. Analysts are dealing with intricate networks that involve multiple data elements such as events, people, and locations. The ability to dynamically navigate the data is crucial to make sense of it.
"The sort of human and event networks we are working with becomes very complicated very quickly. If you work with a static network or some force directed model that you can’t adjust, it’s not really usable."
Analysts must also identify geographical patterns and connect the dots between those various pieces of information, all while correlating the findings with the reality on the ground.
"The inability to visualize networks of geo-localized data is a major obstacle to effectively taking advantage of data."
To empower its team and make the insight generation process as effective as possible, the CTP director decided to leverage Neo4j graph technology, along with Linkurious Enterprise. "As soon as we learned what graph technology was, we wanted to move to it because it was so clearly optimal for the kind of work we do."
They built their data-intelligence platform with a data ingestion and management system based on a Neo4j database and Python scripts. Linkurious Enterprise provided the graphical user interface layer, with visualization capabilities, to let analysts visualize entities both as networks and geographically.
"Linkurious Enterprise was the only tool we found that allowed us to update dynamically a database without any user intervention and that could produce publication-ready graphics. We now use it for entity network mapping and visualization on a daily basis."
The CTP team uses the interactive graph visualization interface of Linkurious Enterprise to dynamically explore the networks of data collected beforehand. With the help of the geo-spatialization feature, analysts can visualize geo-localized data to unveil and understand patterns of events.
"We were already able to geo-visualize data, using Google Earth, but the stylization was unimpressive and, again, did not dynamically update. The geo-visualization feature of Linkurious helped us get to a much more optimal solution of that problem as well."
With a consolidated workflow, including data processing, visualization and analysis, CTP analysts can fully take advantage of their intelligence model. They save time and generate accurate networks based on their understanding and knowledge of the data.
"Analysts ingest the data into our database system and create entities and connections while visualizing the networks as they are shaping themselves."
They are also able to find critical insights with the interactive visualization interface or the geo-spatialization feature. CTP’s analysts are able to piece together complex networks involving individuals, geographical or event data in order to understand and predict conflict dynamics.
"For instance, we use the Linkurious geo-spatialization feature a lot. We geolocate what we call ‘kinetic events’ to the best of our abilities and analyze where and why they are occurring. With a good ability to visualize the geo-spatialized relationships, our analysts can identify patterns and recognize anomalies."
Linkurious Enterprise is now part of CTP’s analysts’ daily missions. The team uses it to conduct intelligence investigations and to produce data graphics for its weekly Threat Update publication.
"The integration of Linkurious helps unlock the full potential of our data, tools, and workflow. It saves us time, in terms of analysis and publications, allowing us to get insight out there much more rapidly. Linkurious is now part of our base workflow and core products."
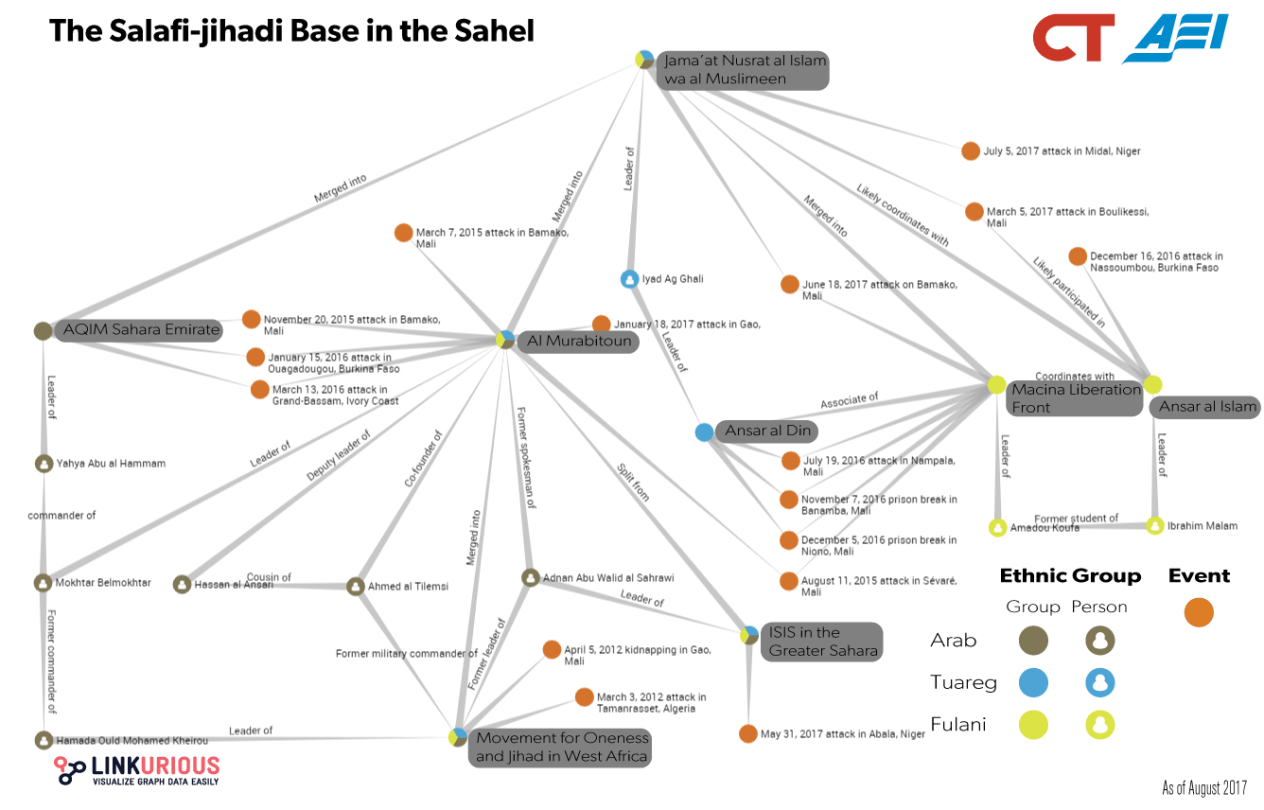
After meticulous information-gathering and cross-checking, with the help of graph technology, the CTP team highlighted the complex dynamics within the Salafi-Jihadi base in the Sahel. They mapped the connections between events such as the Bamako attack in June 2017, individuals like Iyad Ag Ghaly (leader of Ansar al-Din Islamist group), and parent terrorist organizations like AQIM.

Generating these networks allows analysts to track movements and affiliations of terrorist leaders and ultimately demonstrate how the Salafi-Jihadi base in Sahel has become a primary source of strength for Al Qaeda and ISIS. In 2017, CTP analyst Emily Estelle published “A Strategy for Success in Libya” analyzing the challenges in Libya and offering specific recommendations.
A spotlight on graph technology directly in your inbox.

