The Generals of Gold: a data-driven investigation of the Egyptian army influence
 In this blog post, Wael Alalwani from Noonpost explains how he used Linkurious for large-scale investigations in a project on Egypt’s corruption networks.
Noonpost is an interactive Arabic media website that specializes in delivering deep views and studies on contemporary issues. Noonpost encourages freedom of expression and public debate.
The Generals of Gold is a project composed of 12 episodes where we present the intertwined relations of Egypt’s military generals and businessmen across kinship, affection, official positions, and benefit-based networks. Throughout the episodes, our network visualization and analytical articles show the various conflict of interests and a systematic exploitation of the Egyptian economy favoring the ruling elites.
On the 25th of January 2011, the Egyptian people called for “bread.. freedom.. social justice” commencing a revolution that inspired freedom seekers around the world. Since then, the revolution had its ups and downs, but its latest chapter was very severe, ending with a tyrannical coup d’état led by the army in 2013.
Trying to understand why the revolution declined, we came to realize that revolutionaries and activists did not really understand the complex nature of the struggle. The more you try to uncover details and understand the revolution foes, the more you realize that they army and its business affiliates are well connected and have developed resilient mechanisms to maintain their grip on power. So, we became more convinced about the importance of studying the connections and complex networks of the army and its affiliates. This was done through activating the role of data journalism by exposing such details in the form of reports and open data to the public. Data journalism and the right of accessing data for everyone became key elements in our battle.
It wasn’t that we were uncovering completely unprecedented insights. It is widely known amongst Egyptians that nepotism and corruption flourish in the army and its institutes, and that the army has a major role in influencing the whole economy, either directly or indirectly. This perception is inevitable given the fact that unlike many other armies, the Egyptian army lacks transparency in publishing its actual budget and the defense spending. Nothing was completely unprecedented. However, by blending network data with investigative reports, we were able to produce compelling stories that allow the public to comprehend the magnitude of the army’s influence in a data-driven way. This will help active communities in reviving practical and data-informed revolutions.
In his latest BBC documentary, Hypernormalisation, Adam Curtis argued that politicians have deliberately constructed a simpler version of the world in order to remain in power. He called it a fake world that hides real complexities “because the simplicity was reassuring“. This simplicity not only led people to become subservient and the effect of activists attacking the system to become marginalized, but also it made “our whole counterculture to actually became part of the trickery“. Simplicity is our enemy!
The Generals of Gold project aimed to advance public awareness to a level where comprehending the intertwined and complicated networks of the army and its affiliates could be achieved. Complex networks and connected data are best presented in network and graph visualization.
We considered many open source and paid software, but at the end, we chose Linkurious because of the following:
- Our main requirement was to have an end-to-end solution that covers our research process starting from direct data entry to the graph database (Neo4j), to indexed instant-search, to visual exploration, all the way to running analytical queries. This is all supported by Linkurious.
- Linkurious supports UTF8 (Arabic text in our case) in an excellent way. With a very minimal tweak, Arabic text search in Linkurious was enhanced by applying Arabic stemming, phonetics, tokenization, and other NLP-based rules.
- We saw how Linkurious was used for ICIJ’s Panama Papers.
- Linkurious’ great integration with Neo4j and the support of multiple data sources.
- It was important for us to have a tool that supports pinning nodes and embed their coordinates when the visualization is exported to JSON. Linkurious supports this perfectly.
- Linkurious’ instant geo-mapping.
We started by defining our research objectives, hypothesis, and the network boundaries. Then we created a comprehensive property graph model that can help us in answering our questions. After that, we started to collect the data manually. 90% of the data was collected from publicly available data (reviewing more than 1000 news sites and research studies, mostly state-owned media outlets). The remaining 10% was through private sources. Then, we performed visual exploration on the data and validated our hypothesis. Finally, we generated networks that supported the articles we wrote.
We used the Neo4j Graph Database to store and organize the connected data into a single data model, so that we can easily query the information to find patterns.
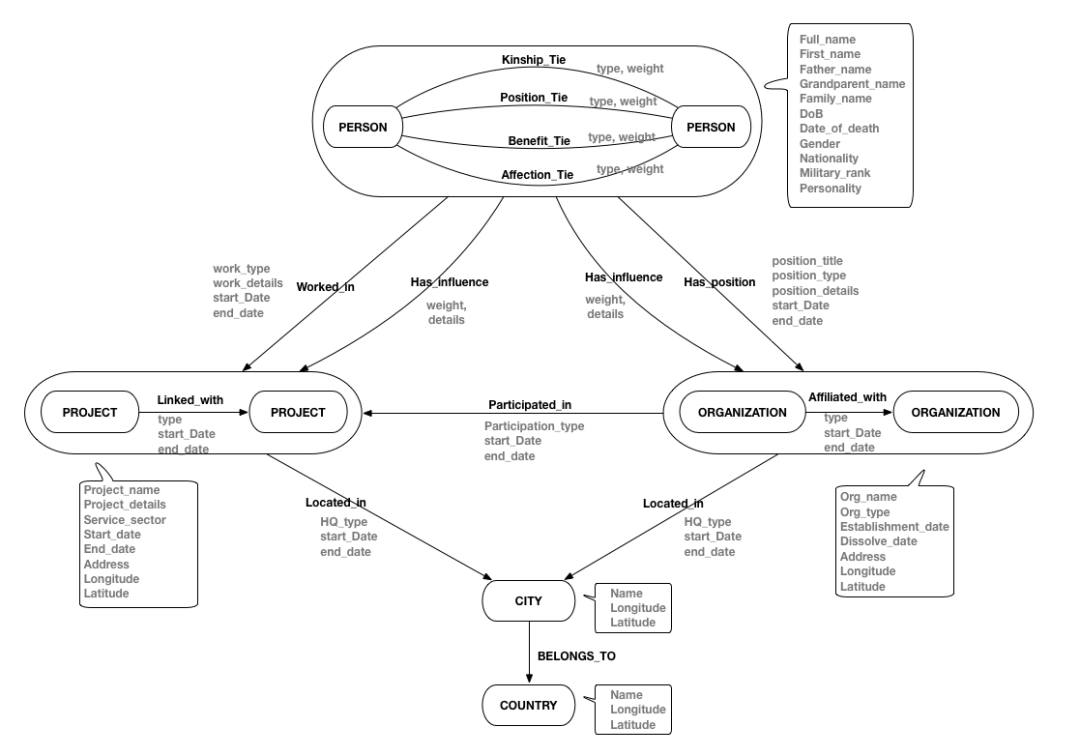
In the quest of understanding the complex nature of the state-sponsored corruption in Egypt, we decided to study three main entities and the key relations within and among them. As can be seen in the model above, various data about Person, Organization, and Project entities were collected. We decided to distinguish the formal position tie from the influence tie between Person and Organization, as well as Person and Project, in order to handle all the possible scenarios. Some government organizations have authorities and agencies that belong to them or affiliated with them, hence we created “Affiliated_with” tie to capture such a relation.
Although Projects seem to be independent, it was important for us to capture those projects that were linked in a way or another, like being funded from the same IMF loan. Final note about the model is that we prepared it, and hence the collected data, to handle temporal/longitudinal analysis. This is why all the ties capture “start_date” and “end_date” of the relation between entities.
We generated 12 networks where each network presented the complex relations that belong to a specific sector. Through these networks, we were able to validate one of the hypothesis we originally had which states that there is a competition between the Egyptian army and the Egyptian General Intelligence Directorate to dominate each sector, and that some private sector companies are paying the price. Each competitor has its allies ranging from businessmen, companies, thinkers, consultants, to journalists and media outlets. What is alarming is that such a pattern is recurring and it exists in most of the economy sectors.
Take for example the “Health Sector” network. Our investigation and analysis showed that the Egyptian army has a strong influence on Ministry of Health through two minister assistants: Hisham Abdelraouf (Primary Health Care Assistant) and Elsayed Shahed (Financial Assistant). Both used to have official positions in army-affiliated agencies. This has eventually led to rewarding the army’s agency “Armed Forces Medical Services” with key projects to the Egyptian economy.
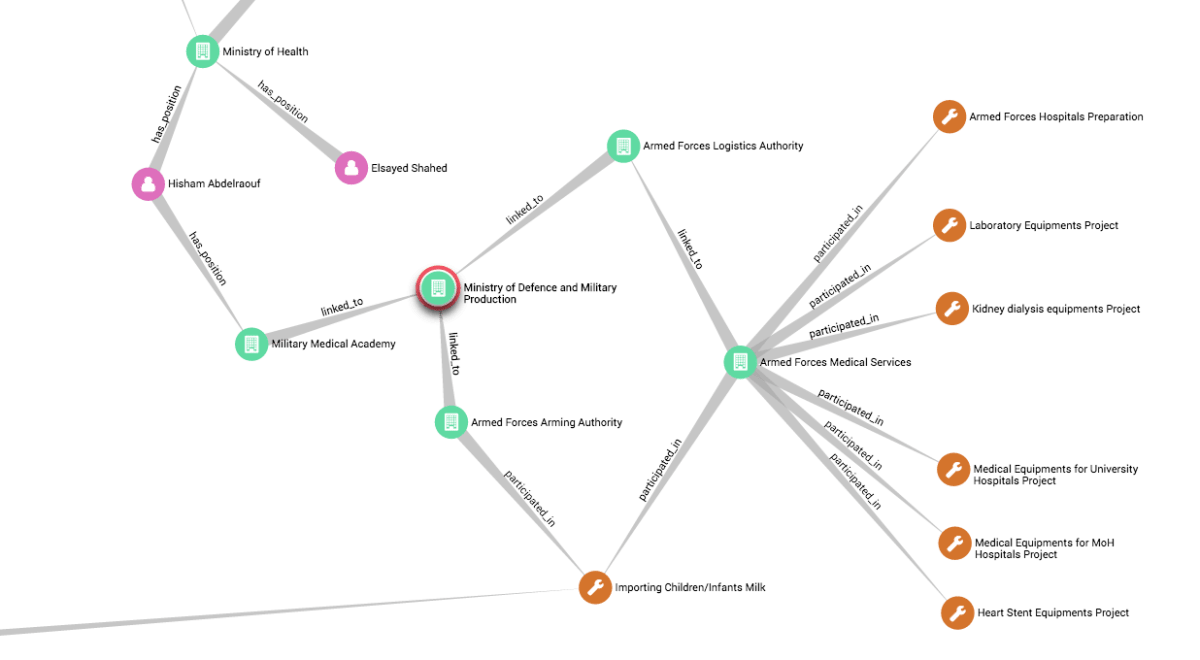
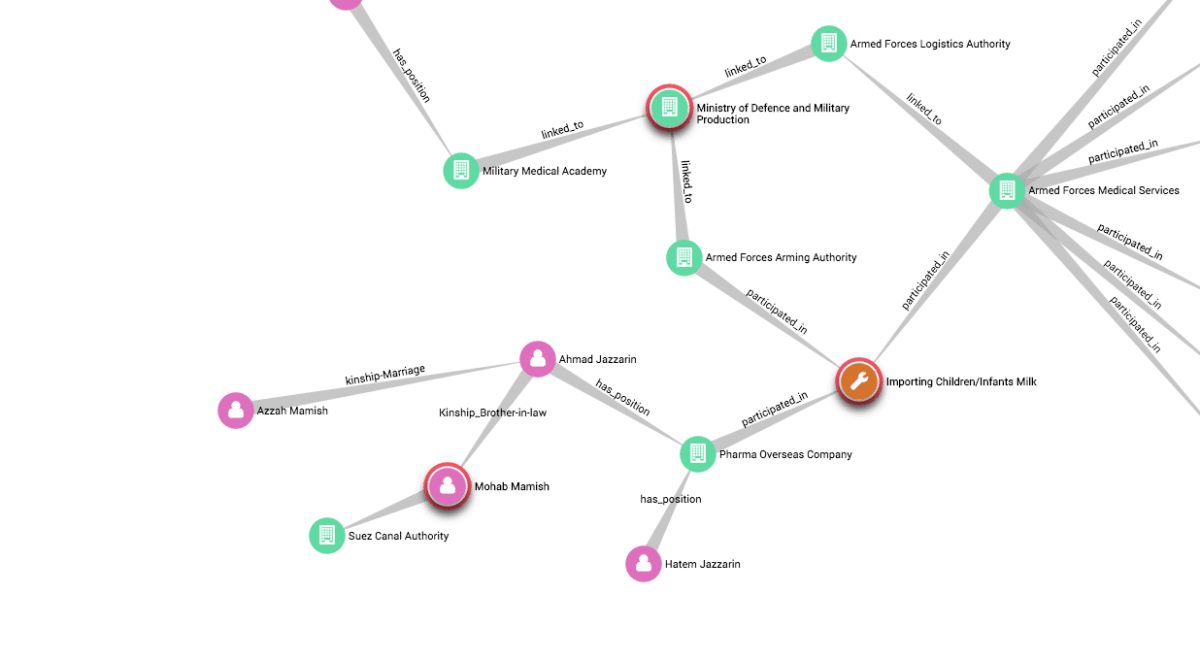
In most projects, the armed forces contracts with private sector companies, which are connected in a way or another to the army. As an example, importing the children/infants milk project was given to Pharma Overseas Company whose Chairman of Board of Directors is Ahmad Jazzarin, the brother-in-law of Vice Admiral Mohab Mamish, chairman of the Suez Canal Authority and former Commander of the Egyptian Navy. Speaking of the infants milk project, the army acquired it through what is thought to be a planned plot by eliminating all existing importers in the market and then manipulating the Egyptian public to ask the army to step in.
Moving to the other competitor, the Egyptian General Intelligence Directorate (EGID), our analysis has shown that there are two key private sector companies linked to EGID that handle large scale projects in the health sector: The Egyptian Pharmaceutical Trading Company and Wadi El Neel For Medical Services. Until now, EGID’s influence in this sector is not as strong as the army’s. However, it is rapidly growing and it is clearer in other sectors. EGID influences MoH through the “Drug Planning and Policies Center”.
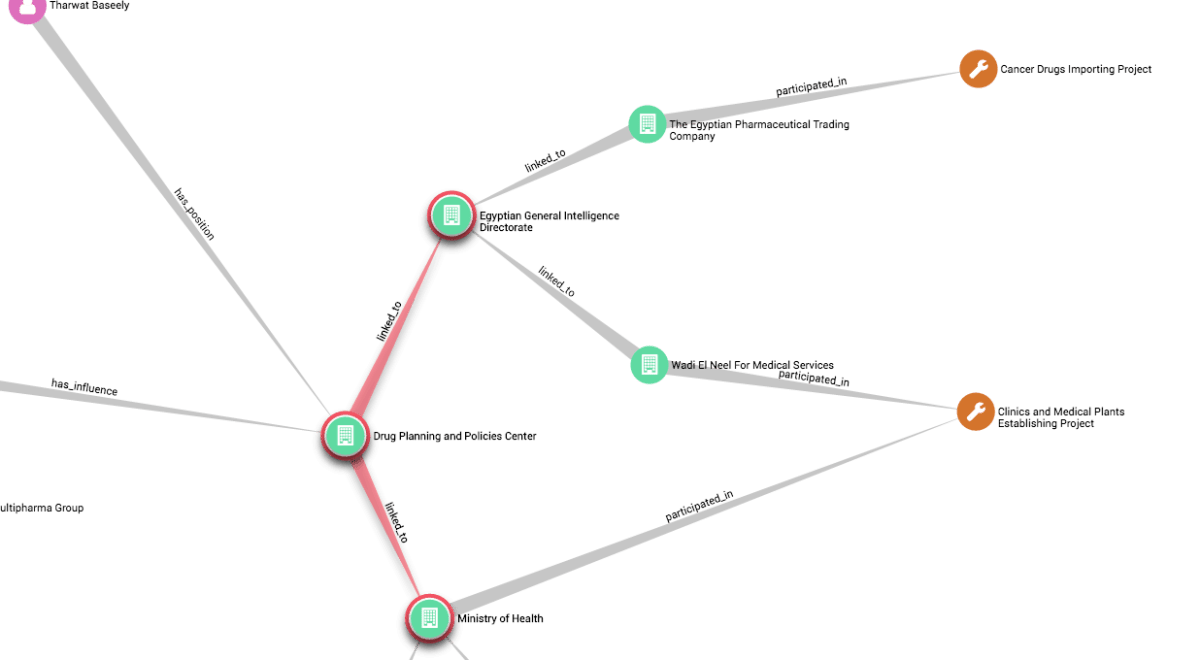
The “Drug Planning and Policies Center” used to be influenced by Tharwat Baseely and Ahmad Elezaby, who both belong to the private sector and the latter is the president of the Pharmaceutical and Cosmetics Appliances Chamber, which belongs to the Federation Of Egyptian Industries.
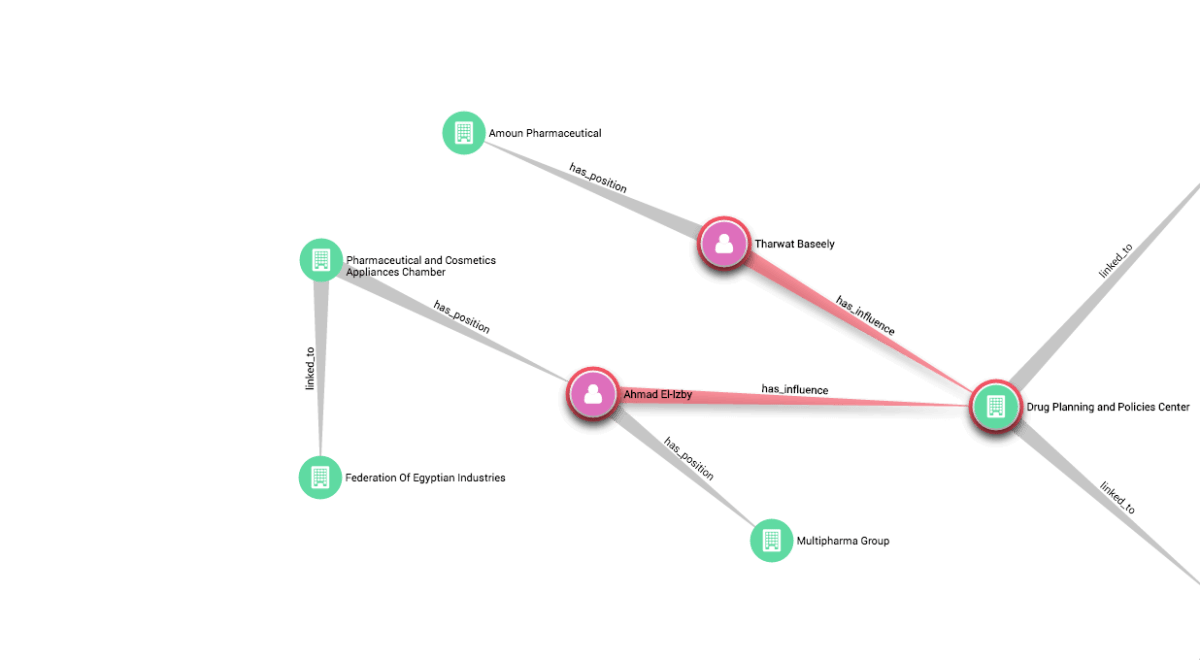
Drawing the “Health Sector” network allowed us to visualize and understand the links behind the conflict between “Pharma Overseas Company” and “Multipharma Group” over the Hepatitis C Sovaldi Drug Importing. Such a conflict is part of the army’s struggle, along with its affiliated companies, to eliminate the private sector companies and declare maximum dominance over the health sector.
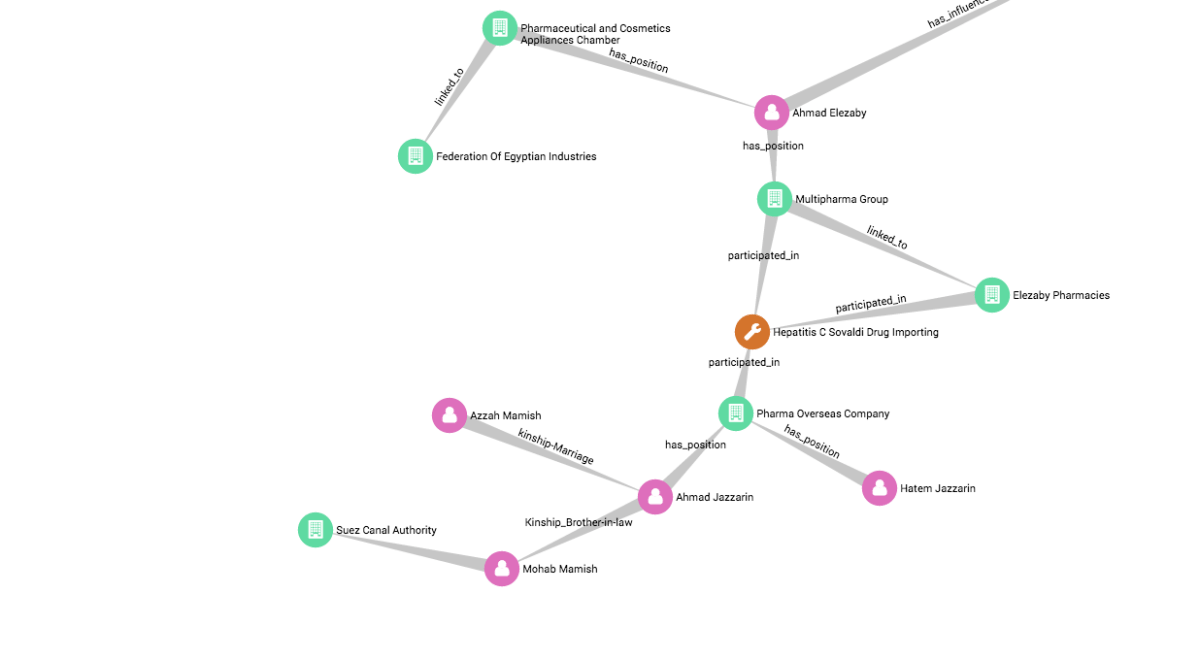
In our published article (Arabic) on the health sector network, we provided more details about this competition.
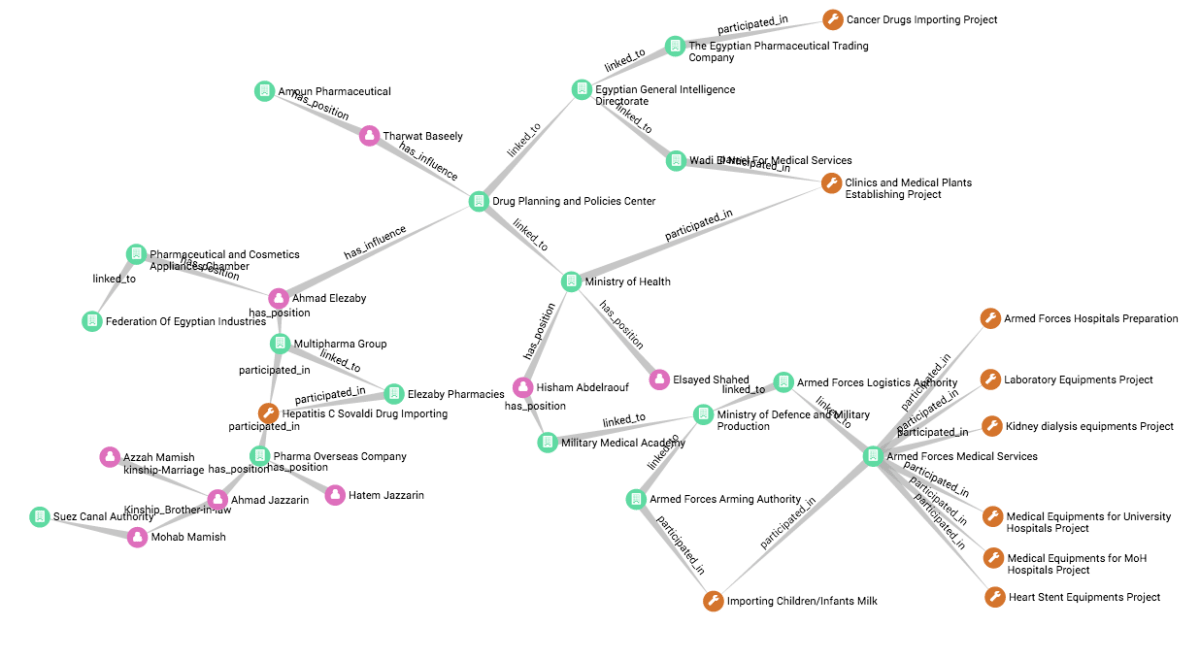
We applied similar analysis to other sectors, in which more complex patterns were identified. For example, in the “food sector“, we were able to identify a French and a Russian conglomerates (almost mafias) that dominated the wheat imports business. The former was backed by the General Intelligence Directorate whereas the latter was backed by the army. This was achieved through visually grouping relevant entities into communities, based on specific criteria and the availability of the data.
Studying the “tourism sector“, we were able to identify, through path-following, how the Egyptian armed forces leased important touristic spots to one of its authorities and directly competed with the private sector, creating unfair competition in its quest to completely dominate the whole sector.
Similar findings were created by studying the “petrochemicals, energy and minerals“, “communications“, “industry“, and “national projects” sectors. Also, we studied the organization hierarchy/structure of the army. Finally, we produced another interactive visualization showing the ruling families of Egypt since 1952.
Generally speaking, the network boundaries, collected data, and research questions that we defined led us to rely heavily on visual exploration. However, we used various queries that helped us to identify interesting starting points and patterns. For example we used this query to find people who have kinship tie with others who own at least one private company:
MATCH (a:شخص)-[r1:رابطة_دم]->(b:شخص)-[r2:له_منصب]->(g:منظمة)
where r2.نوع_المنصب = ‘مالك’

RETURN a, b, g, r1, r2;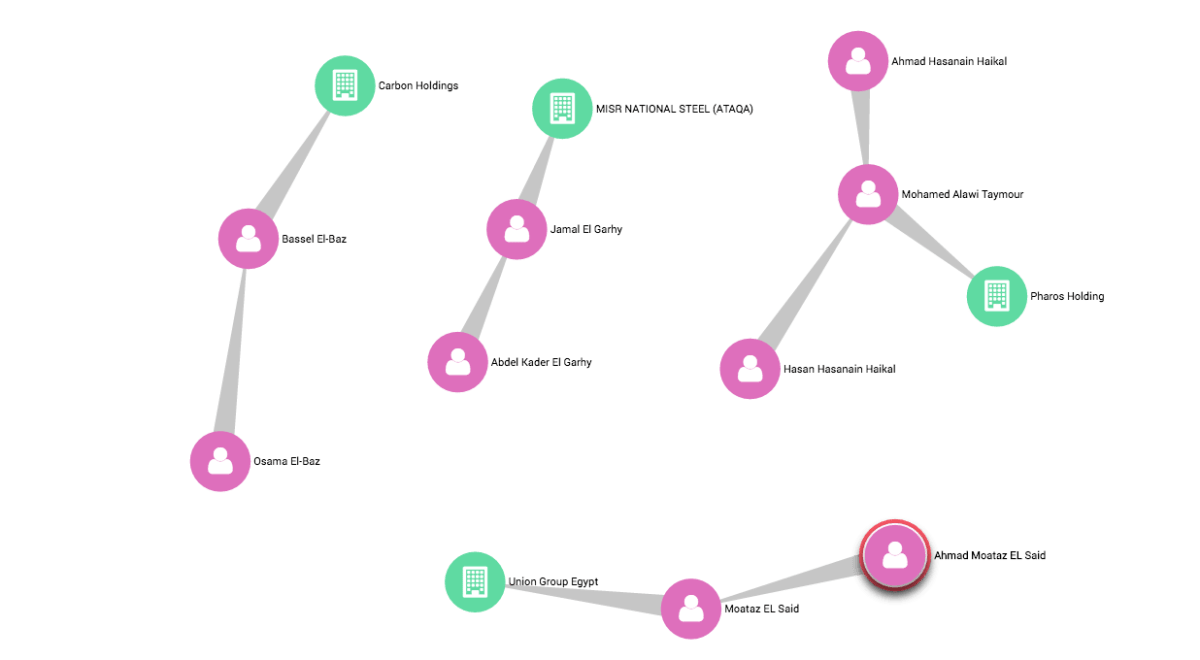
Also, we were interested in finding Missing Triadic Closures. If there exists a strong tie between A and B, A and C, then there is a weak or strong tie between B and C. This helped us in finding the missing ties in data between B and C that we did not originally capture.
MATCH path1=(p1:شخص)-[*2..2]-(p2:شخص)
where not((p1)-[]-(p2))

return path1

limit 50;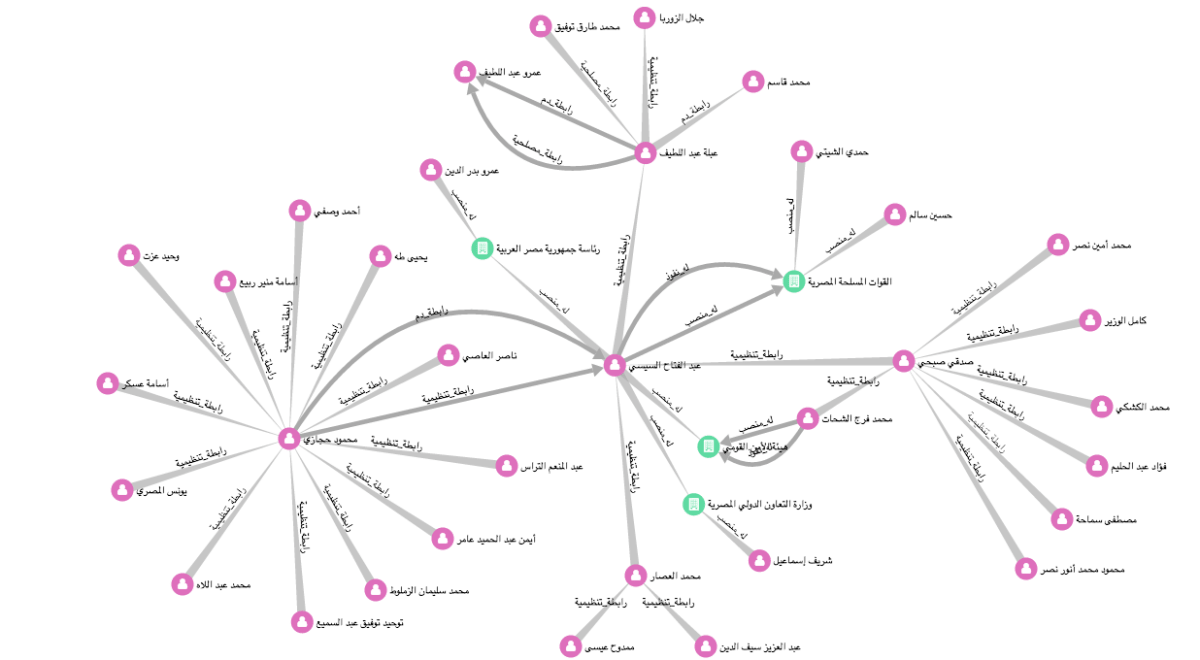
Our experience with Linkurious was very pleasant as it helped us in fulfilling our objectives and needs. The key takeaways are:
- The importance of defining clear research objectives and practical network boundaries.
- Defining robust data model is very essential step to answer the questions and test hypothesis.
- Applying continuous exploration and visual analytics is always important to identify gaps in data and to extract key insights.
The next step is to enhance the model and data we have to build temporal/longitudinal networks, to understand the rise and fall of specific networks communities in chronological order. Moreover, we will keep updating our data and explore the possibilities of enriching our data with publicly available data sources in an automated way.
Whether is it to investigate financial ties, leaked documents or to understand and highlight influence networks as we’ve seen here, graph technologies are a powerful tool to find stories hidden in large data sets. Linkurious allows to visually explore and query highly connected data in order to reveal the sometimes not-obvious relationships between entities.
With this impressive project, Noonpost’s actors show us how graph technologies can become an ally for journalists within data-driven investigations.
If you wish to learn more about “The Generals of Gold”, you can get in touch with them by email and find them on Twitter and Facebook.
If you have a project you would like to discuss or want more details about Linkurious, don’t hesitate to contact us.
About the author
 Wael Alalwani works as a data management and analysis consultant in the Middle East and Canada. He developed a number of projects using social network analysis and graph technologies. He is currently working on a project that shows the Syrian regime’s influential networks, which will most likely lead the rebuilding of Syria. He publishes Arabic articles that shed light on global projects and movements that could inspire positive change in the Middle East.
A spotlight on graph technology directly in your inbox.

