Data pre-processing in Linkurious: Enhancing data and improving investigations with graph analytics
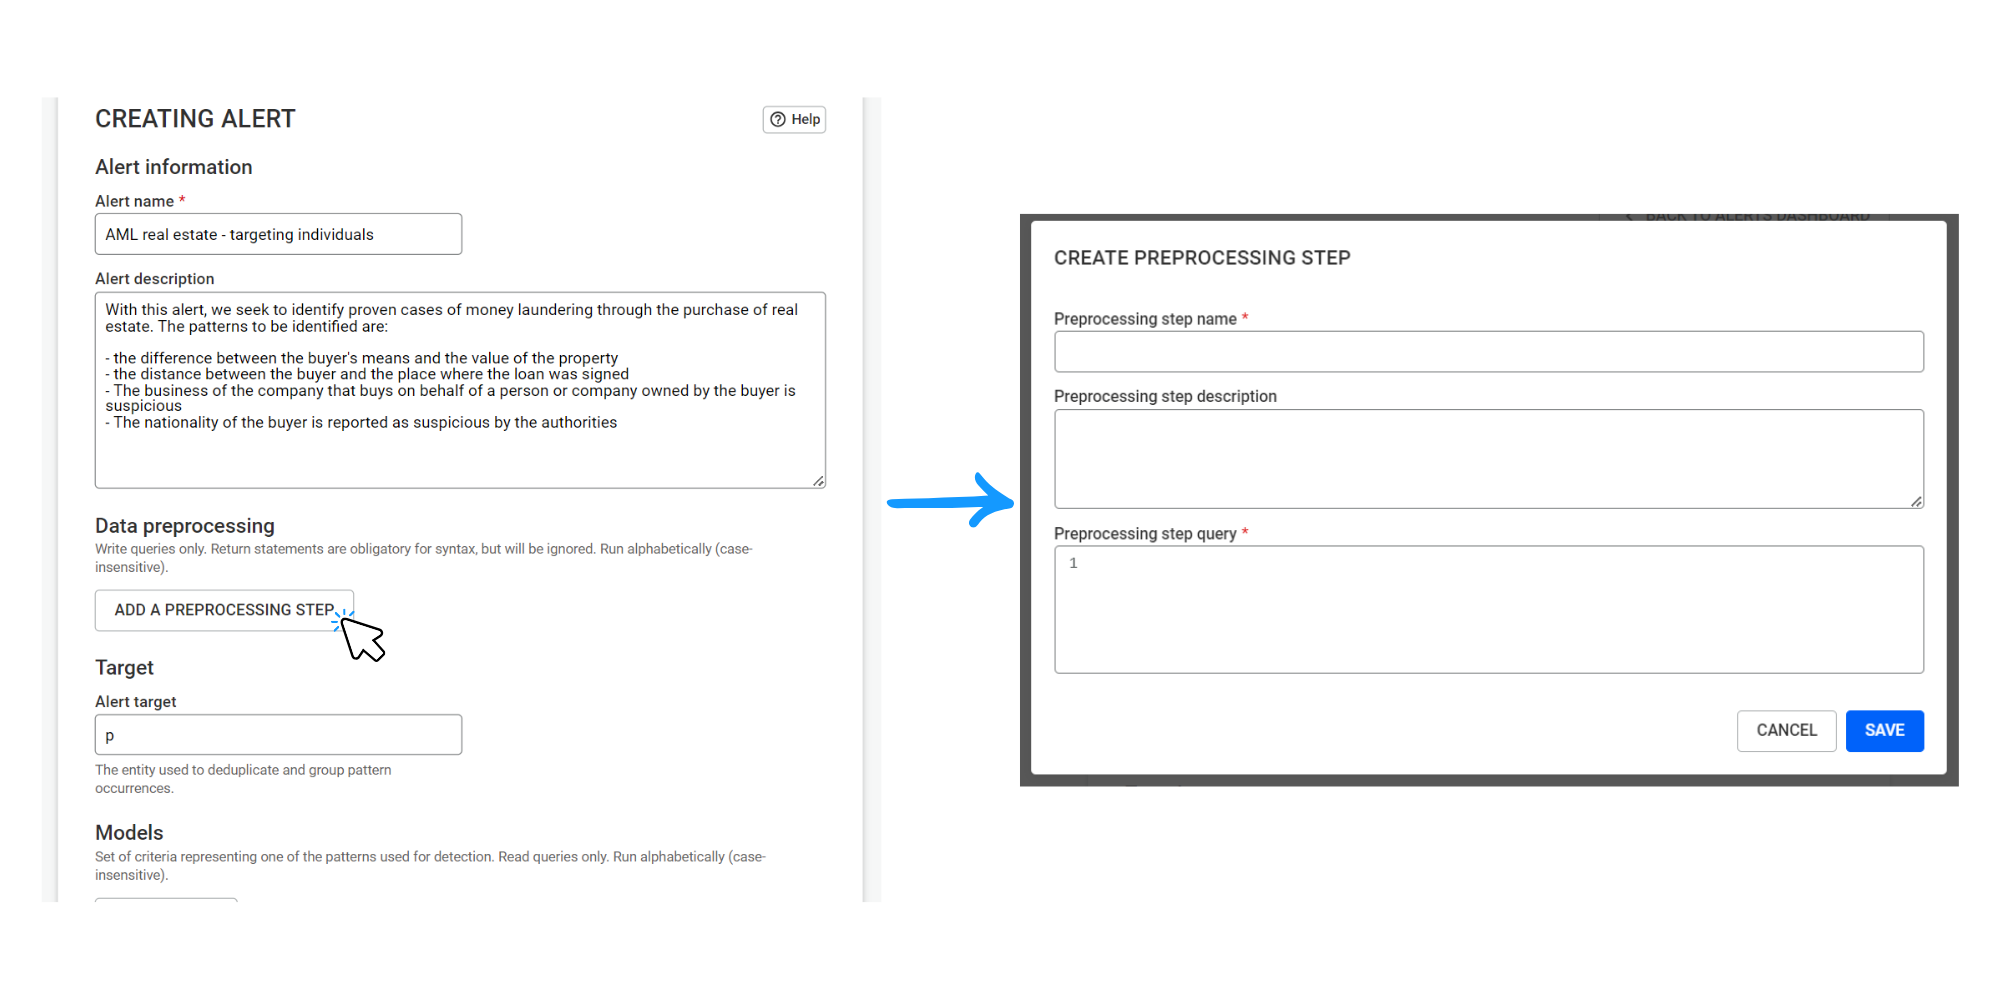
Graph analytics have just become more accessible in Linkurious through the brand new feature called data pre-processing. Available through the alerts interface, data pre-processing offers the ability to execute arbitrary queries that modify the data. You can go from graph query to an ongoing and automated data enhancement process in minutes.
Data pre-processing opens up the possibility of leveraging graph analytics to enrich your data, enabling more advanced alerts and more efficient investigations. It can be simple graph analytics like using graph queries to fix data quality issues or to perform data normalization. Or, you can apply more complex graph analytics by calling Memgraph MAGE or Neo4j GDS to execute graph algorithms like community detection, PageRank, etc.
This is another step in bringing even more context to your data analysis. Read on to learn how data pre-processing works, and to see some examples of its applications.
What is data pre-processing, exactly? It is a specific step in alerts within Linkurious, where you can execute graph queries and write the result to the graph within the configuration panel. Data pre-processing lets you go from graph query to an ongoing and automated data enhancement process in just minutes.

We introduced data pre-processing to reduce the friction to using graph analytics. It also lets you enhance your data directly within Linkurious. If you’re a data scientist who is already familiar with graph analytics, this feature offers a way to effectively operationalize your graph analytics queries. And if you’re not already using graph analytics, it’s a way to get started. For many pre-processing use cases, you don’t even need a graph algorithm library like Neo4j GDS or Memgraph MAGE.
With data pre-processing, queries write or modify the graph database.
There are a ton of ways you can put data pre-processing into practice. To illustrate the kinds of actions you can take with this new feature - and to help you get inspired - we’ve put together a few use case examples.
In this example, imagine you have a dataset of clients that includes data on their nationalities. You want to use the notion of “risky nationality” in visualizations - assigning a specific color for people with a risky nationality, for example - or in alerts. Using the data pre-processing feature, you can create a new property with that information with the following query:
//Description: add a risky_country property
MATCH (a:PERSON)
WHERE a.country = 'Iran' OR a.country = 'North Korea'
CALL {
    WITH a
    SET a.risky_country = 'yes'
} IN transactions OF 10000 rows
RETURN 0
A similar approach could be used to do data cleaning or to normalize certain data fields.
In this example, you have a supply chain dataset where companies are connected to suppliers, locations, and risks. Say you want to identify all the risks each company is indirectly connected to and use that information to create an aggregate risk score. This allows you to switch from an entity-centric view of risk to a network-based view of risk that takes indirect risks into account.
Here’s what the query would look like:
//Description: identifies for each company the climate risks it's connected to and aggregate those risks into a single score
MATCH (a:Company)-[:HAS_SUPPLIER*1..5]->(:Supplier)-[HAS_SITE]->(:Site)-[:HAS_LOCATION]->(l:Location)

WITH DISTINCT a, l
OPTIONAL MATCH (l)-[:HAS_RISK]->(cr:ClimateRisk)

WITH a, reduce(totalRisk = 0, n IN collect(distinct (cr)) | totalRisk + n.current_risk) AS aggregated_risk
SET a.aggregated_risk = aggregated_risk

RETURN 0
It is also possible to use data pre-processing to compute a network-based risk indicator and combine it with an entity-level risk score to create a hybrid risk score. You can then use such a risk indicator within a third-party system. For example, you might use “number of indirect connections to fraudsters” as a feature for a machine learning model.
In this example, the pre-processing feature is used to leverage graph analytics to identify communities of suspicious individuals. That information is in turn used to generate alerts.
In this use case, there are 3 steps:
- Tag the client with a high risk score as risky.
- Use graph analytics to identify communities of clients sharing personally identifiable information (PII).
- Generate cases for communities of clients that contain a significant number of “risky clients”.
First pre-processing query:
//Description: simple query to add a “RISKY_CLIENT” label to clients with a high risk score
MATCH (a)
WHERE a.score > 0.9
SET a:RISKY_CLIENT
RETURN 0
Second pre-processing query:
//Description: create a virtual graph based on persons sharing common Personally identifiable information (PII) and then use Neo4j GDS and the Weakly Connected Component algorithm to identify communities
CALL gds.graph.drop('lke-entities', false) YIELD graphName AS graph

MATCH (a)-[:HAS_IP_ADDRESS|HAS_EMAIL|HAS_ADDRESS|HAS_PHONE_NUMBER]->(PI)<-[:HAS_IP_ADDRESS|HAS_EMAIL|HAS_ADDRESS|HAS_PHONE_NUMBER]-(b)
WITH id(a) AS source, id(b) AS target
CALL gds.graph.project('lke-entities', source, target)
YIELD graphName AS g1

CALL gds.wcc.write('lke-entities', { writeProperty: 'componentId' })
YIELD nodePropertiesWritten, componentCount

CALL gds.graph.drop('lke-entities') YIELD graphName AS g2

RETURN 0
Model query, where the target is clients:
//Description: alert model that identifies communities with at least 50% of “risky clients”
MATCH (a:PERSON)
WITH
    a.componentId as component, collect(a) AS clients,
    COUNT(CASE WHEN a:RISKY_CLIENT THEN 1 END) AS risky_clients,
    COUNT(CASE WHEN NOT a:RISKY_CLIENT THEN 1 END) AS normal_clients

WITH component, clients, size(clients) AS total_clients, risky_clients, normal_clients
WHERE normal_clients > 1 AND risky_clients > 1

WITH component, clients, total_clients, risky_clients, normal_clients, 1.0 * risky_clients / total_clients AS risk_ratio
WHERE risk_ratio >= 0.5

CALL apoc.path.expand(clients, "HAS_IP_ADDRESS|HAS_EMAIL|HAS_ADDRESS|HAS_PHONE_NUMBER|HAS_BANK_ACCOUNT", null, 1, 2) YIELD path

RETURN clients, collect(path) AS paths
Data pre-processing is a new way to facilitate your graph investigations, using graph analytics to bring more context, faster. It lets you automate data enhancement, which can now be done directly in Linkurious.
To learn more about implementing data pre-processing in Linkurious, or to learn how you can get started on graph investigation, contact us.
A spotlight on graph technology directly in your inbox.


