We are launching Graph Viz 101, a series of posts to teach the basics of graph visualization, written by Sébastien Heymann in collaboration with Bénédicte Le Grand of Université de Paris 1. This is our second post, please discuss it below!
Information visualization has been used to support social network analysis since the 1930s with the “sociogram” of J. Moreno (Moreno 1937), which is a graphic representation of social ties among a group of people. Despite the early beginning of network visuals, we had to wait until the 1990s and the democratization of computer graphics to see the development of interactive visualization software, which has made the interactive exploration of complex networks possible. Pajek (Batagelj 1998) is the most noticeable tool, as it provides both statistical algorithms and visual representations of social networks. Its methodological book entitled “Exploratory Social Network Analysis with Pajek” was published in 2005. The contribution of Information Visualization to science is stated in (Fekete 2008):
« Information Visualization is meant at generating new insights and ideas that are the seeds of theories by using human perception as a very fast filter: if vision perceives some pattern, there might be a pattern in the data that reveals a structure. […] Therefore, it plays a special role in the sciences as an insight generating method. »
More generally, Information Visualization is a way to reveal data properties which would not be trivially detected otherwise, to shed light on breakthroughs, and to share the poignant experience of “Aha, I see!” (Few 2006) thanks to its intuitive aspect. This research field contributes to the emergence of novel scientific theories by improving the exploitation of human cognition. According to Card, Mackinlay and Shneiderman (Card 1999), the main focus of visualization is indeed to amplify cognition. The authors listed a number of key ways to do so, showing the advantages of using visualization techniques during data exploration:
- Reducing time spent looking for information,
- Enhancing the recognition of patterns,
- Enabling perceptual inference operations,
- Using perceptual attention mechanisms for monitoring tasks,
- Encoding information in an actionable medium.
In this blog post we provide a short introduction to the perceptual support of visualization.
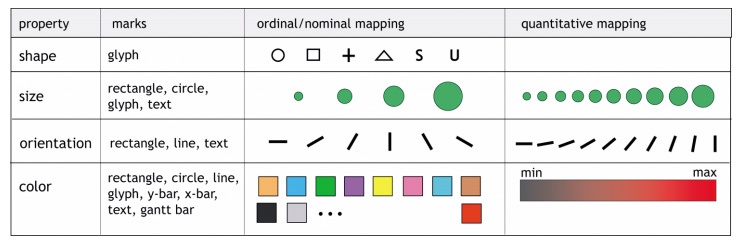
Information Visualization relies on the properties and perception abilities of the human visual system. According to Information Theory, vision is the sense that has the largest bandwidth (100 Mbits/s), which makes it the best suited channel to convey information to the brain (in contrast, audition has only around 100 bits/s) (Ware 2004). Visualization hence requires building and applying a visual language to encode information that can be read and interpreted correctly. This operation is called a mapping between data variables and visual variables. This language relies on visual features like geometric primitives, colors and sizes, and was theorized in (Bertin 1967) and (Cleveland 1984), and extended in (Mackinlay 1986).
However selecting visual features to convey information is not trivial. One would indeed like to select the most effective ones, but while avoiding misunderstandings and over-interpretations. Well-established guidelines distinct two kinds of data variables: quantitative and qualitative variables (see the following table). Visual features can be selected according to the type of data, but difficulties remain when mixing different visual variables in the same image.
Two main psychological theories explain how vision can be used efficiently to perceive features and shapes, according to (Ware 2004): the preattentive processing theory, and the Gestalt theory.
Some visual features are particularly efficient as demonstrated in (Triesman 1985) and (Healey 1995), an effect called preattentive processing. Visual saliences, i.e. elements and patterns which perceptually stand out from the remainder of the picture and grab the attention of the observer (Itti 2001), can be perceived very quickly (in an order of less than 250 milliseconds) and can be recognized “at a glance” without any cognitive effort, even if it has been found that the attention level plays a critical role. An example is illustrated in the following figure, where we spot the red letters among several dark letters (left image), as well as we spot the T among lines very quickly (right image).
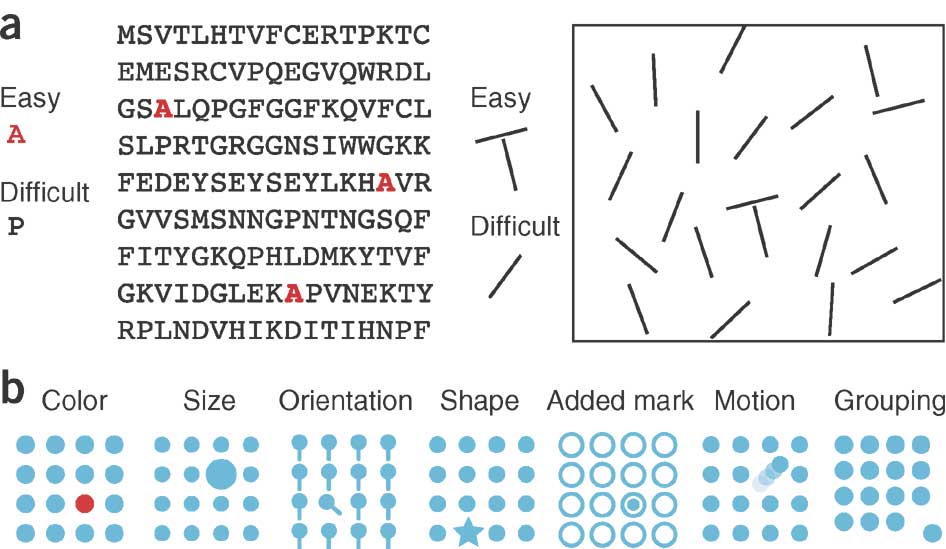
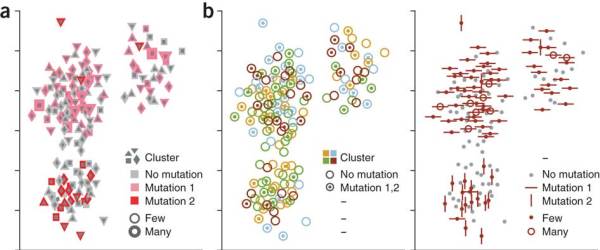
But mixing colors and shapes forces us to pay a speci c attention to each item, as we see in this illustration:
The Gestalt theory, established in (Koffka 1935), explains the main principles that lead to images interpretation. (Ware 2004) summarizes them as follows:
- Proximity: Things that are close together are perceptually grouped together;
- Similarity: Similar elements tend to be grouped together;
- Closure: A closed contour tends to be seen as an object;
- Continuity: Visual elements that are smoothly connected or continuous tend to be grouped;
- Symmetry: Two symmetrically arranged visual elements are more likely to be perceived as a whole;
We illustrate these laws in the following table (unknown source):
In this blog post we have provided a very short introduction to the perceptual support of visualization. Please complete it using the comments below! In the next post we will outline the way knowledge can be generated from visualization.
A spotlight on graph technology directly in your inbox.