Last week we saw the sophisticated schemes criminals use to defraud banks. The TL;DR version of this is : criminals create fake identities, ask banks for loans and disappear with the money. By going through the techniques used by criminals we identified the graph challenge they face : creating and managing a network of identities supported by false and real documents. Today we are going to see how graph analytics can help banks uncover criminal rings and save money.
First let’s rewind a little. The key to loan fraud is creating fake identities. This involves mixing pieces of information, false and real, to create identities that are :
- distinct : each distinct identity will allow the fraudster to ask for a loan ;
- credible : the identities need to by-pass the bank’s security checks procedures ;
Translation : fraud and security analysts need a solution that can analyse individual customer identities and look for suspicious connections with other customers. Simple enough? Not really. Large banks have dozen of millions of customers. Finding connections between them is the perfect needle-in-a-haystack big data problem.
Relational database management system (RDBMS) are not adapted for that kind of problem. Contrary to what their name suggests, relational databases are not good at handling relationships. If you are writing queries that are highly recursive or span across multiple tables, it will take time for a RDBMS to return results. To handle use cases like fraud where finding connections in the data is key, graph databases are much better adapted. Graph databases are designed for the quick traversal of relationships between entities.
Finding extended friends in a 1M people social network (from the book Graph Databases)
The benchmark above shows the difference between a graph database (Neo4j in this example) and a RDBMS. Take 2 random nodes in a 1M person social network and try to find connections between them. If you’re considering only a depth of 2 (friends-of-friends) both the RDBMS and Neo4j offer acceptable performances. However as depth degree increases, relational databases can no longer deliver acceptable results in a quick fashion. In the meantime, Neo4j remains fast.
To identify fraudsters, graph databases are a key tool. But how to use it?
In order to illustrate how to use graph to catch fraudsters, we are going to use an example put together by Kenny Bastani on GraphGist. If you haven’t visited GraphGist yet, I suggest you do it : it’s a great resource for graph-related use cases.
When thinking about a graph project, the first step is to come up with a data model. The data model is the way we are going to represent the data we have. In order to build a good (graph) data model, it is usually a good thing to think about what we are trying to accomplish.
Here, we want to detect fake identities. To do that, we are going to focus on the pieces of information banks have on their customers. We want to look for shared information. Fraudsters tend to recycle pieces of information, hence finding shared information will put us on the trail of fraudsters.
The graph model we are going to use will be centered around the customers and the information they provide the bank. Here is a picture of a graph model for fraud detection :
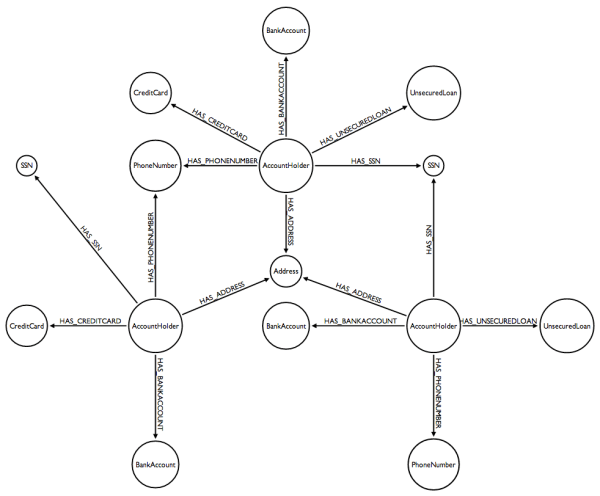
The graph above connects customers to bank accounts, credit cards, loans, phone numbers, social security numbers and addresses. The kind of information a bank have. What we can see above is the graph is that two customers (or account holder) can be connected through a common relationship with an address (they share the same address), a phone number (they share the same phone number) or any other piece of information.
Now that we have adequately modeled the data, it is time to go hunting for fraudsters!
What are we looking for exactly? We want to find fraudsters, people who have fake identities and share common pieces of information. Let’s try to express this in a “graph” language. We want to find people who are connected through at least two of the following items : a credit card, a loan, a phone number, a social security number or an address.
Most graph databases have their own query languages. They allow to express the pattern above in an abstract way. In the case of Neo4j, this language is called Cypher.
Thanks to Kenny Bastani, we have a Cypher query that can help us :
MATCH (accountHolder:AccountHolder)-[]->(contactInformation)

WITH contactInformation, count(accountHolder) AS RingSize

MATCH (contactInformation)<-[]-(accountHolder)

WITH collect(accountHolder.UniqueId) AS AccountHolders, contactInformation, RingSize

WHERE RingSize > 1

RETURN AccountHolders AS FraudRing, labels(contactInformation) AS ContactType, RingSize

ORDER BY RingSize DESC
The result of this query is a list of potential suspects.The bank can now start investigating them further to find out whether they are criminals or not. If you want to try this on your own, I recommend going to GraphGist to read Kenny Bastani’s excellent article or to download this dataset and load it in Neo4j.
The pattern we used here is simple. It would trigger false positives (couples and families for example) and miss criminals. For a real life implementation, this pattern would need to be refined with experienced fraud analysts. The beauty of languages like Cypher is that domain knowledge can be modeled in a graph algorithm and then applied at scale.
Graph analytics offer a unique fraud detection capacity. We have seen that graphs can help banks identify criminals through data. The result can be dramatic. Typically, in the case fake identities, banks uncover the criminals when they have withdrawn all their money. By then, it is usually too late. The money is gone : sometimes it will never be recovered. When it is indeed recovered, it is after time and resources have been spent. With graphs, identifying criminals can happen before the real damages are done. This way, the bank can protect itself by freezing the accounts : losses can then be avoided and criminals brought to justice.
How to apply this then?
A first set of challenges is to setup new processes. Kenny Bastani suggests that graph-oriented algorithms should be run during the key stages of the customer’s lifecycle :
- at the time the account is created ;
- during an investigation ;
- as soon as a credit balance threshold is hit ;
- when a check is bounced ;
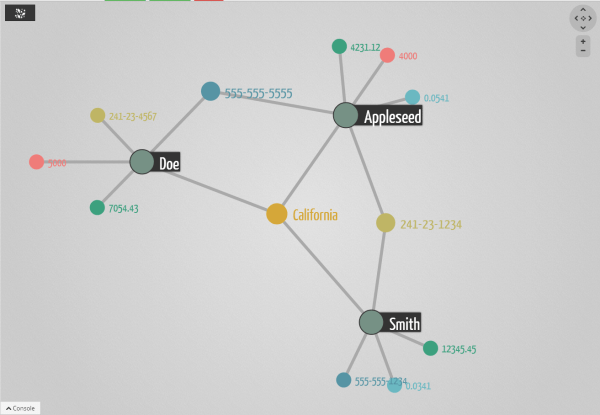
A second set of challenges have to do with the tools needed to analyse the data. Fraud cases are delicate matters. A bank cannot automatically freeze a customer’s account and prosecute him. That’s the reason why even the best fraud detection scheme have a human element to it. In the case of fraud detection, it means that it is necessary to give fraud analysts a tool to investigate the data. That’s where graph visualization solutions like Linkurious are important. Graph visualization allows fraud analysts and people working with graph data to get results faster. With Linkurious for example, it is possible to investigate the graph data above to see directly what has triggered the fraud detection algorithm. Does it look like the suspicious individuals are legitimate? Pulling the data out of the graph database, the analyst can look at it and make a more informed decision.
Fraud detection is fascinating. It pits businesses against sophisticated criminals. However, armed with a deep understanding of how fraud schemes are designed, bank can use their data and graph analytics to identify potential criminals. The result is that risk and fraud analysts can act before damage is done. With graph visualization tools like Linkurious, they quickly decide what to do and save money.
A spotlight on graph technology directly in your inbox.