How to use graph technology to identify criminal activities in call records?
Call records are a great source of information on real-life networks, but finding insights from intricate datasets can be hard. In this blog post, we show how to use graph technology to analyze call records and identify potential criminals. We wrote this article with the assistance of Ashley Englefield, a Detective in California and an instructor at Police Technical.
It is now well known that mobile phone data can be a valuable asset for analysts tasked with the investigation of criminal activity. Phone operators are authorized to collect information about whom their users call, for how long and from where. In certain circumstances, that data can be used by law enforcement. But how can investigators find insights quickly within intricate, sometimes very large, networks of phone records data?
We are going to show how graph technology can assist investigators in analyzing phone call records to identify criminal activities.
To present our use case, let’s use a common scenario: in a residential neighborhood, a store robbery is committed during the day by a group of four criminals. The criminals are masked, they use a stolen vehicle and leave no fingerprints. In that kind of case, finding an answer may take a lot of legwork.
Equipped with a search warrant, law enforcement can contact mobile phone operators to collect information about the calls made and received near the robbery when it happened.
From there, the first step for investigators wanting to leverage graph technology, is to model the data as a graph. The data, phone operators provide law enforcement with, is often tabular (a list) but inherently, phone record data constitute a graph, or a network, of devices linked together via calls. For years, investigators had to work with this data as tables and rows because the technology in use, relational databases, was built that way. Trying to identify unique phone numbers and their relationships from a spreadsheet for instance is tedious. Instead, graph technology allows us to work with the data in its natural form.
We are thus going to use the phone call data to build a graph. That graph will show how phone numbers are connected by phone calls. From a list of calls, we are inferring a network.
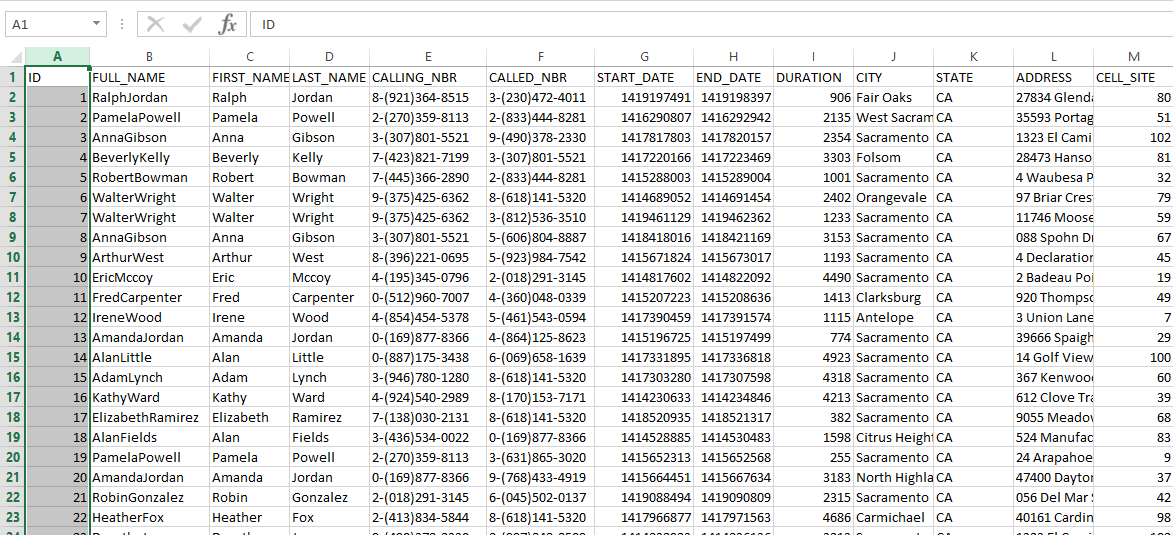
For this article, we have prepared a small dummy dataset using Mockaroo. That data is in a spreadsheet format. Here are the columns:
- FULL_NAME: full name of phone subscriber ;
- FIRST_NAME : first name of phone subscriber ;
- LAST_NAME : last name of phone subscriber ;
- CALLING_NBR: phone number of the caller ;
- CALLED_NBR: phone number of the person called ;
- START_DATE: start of the phone call as a timestamp;
- END_DATE: end of the phone call as a timestamp;
- DURATION: duration of phone call ;
- CELL_SITE: ID of cell site used to route phone call ;
- CITY: city of cell site used to route phone call ;
- STATE: state of cell site used to route phone call ;
- ADDRESS: address of cell site used to route phone call ;
We are going to use the data stored in the spreadsheet to build a graph. In order to do that, we need to define a graph model.
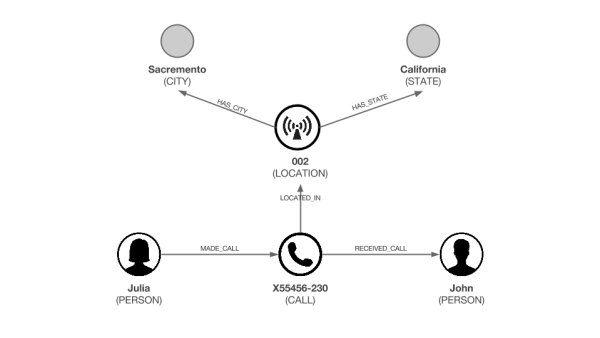
You can see above that our graph model for phone calls is centered around calls. A single phone call connects together 4 entities: 2 phone owners, a location (the cell site the caller was next to when he initiated the call), a state and a city.
It is important to note that in real life, most of the time we would not have access to the names of the phone numbers owners.
Now that we gathered the data and defined the graph model, we are going to populate a database with it. To store our graph, we will use Neo4j, a popular graph database. Those systems are designed to store and work with your highly connected data like our graph. Neo4j has a language called Cypher that makes it easy to import csv files.
Here is a script that can turn our data into a Neo4j dataset:
The result can be found here.
Now that our data is actually stored as a graph, we can use Linkurious Enterprise to investigate the data and find our criminals. The platform is made for investigators and offers visualization and analysis features that don’t require technical knowledge. It works with various graph storage systems, including Neo4j.
In that case, we can use the query template, an investigation feature in Linkurious Enterprise, to look for phone calls made 10 minutes before and after 10:40 am near 2524 Thelma Avenue. Compared to a more “linear” query, our approach allows us to retrieve the calls and their connections: the location, the callers and the callees.
With the query templates, you can build custom investigation workflows for investigators to query graph data without any code. Here is what it would like for the investigator. We have a custom search panel that lets us specify a location, in the city, on a given date, to which we could add any other parameters. Linkurious Enterprise then retrieves and displays the matching data network.
Below is how the query likes in Cypher, the query language for Neo4j :
MATCH (a:CALL)-[:LOCATED_IN]->(b:LOCATION)-[:HAS_CITY]->(d:CITY) <br/>
WHERE id(d) ={{“City”:node}} AND b.address = {{“Address”:string}} AND a.call_s >= {{“Start time”:number}} AND a.call_e < {{“End time”:number}}<br/>
RETURN d, a, dThe query above looks for the phone calls made from 2 of the nearest towers from 2524 Thelma Avenue, where the call started between 10:29 and 10:49. We use a timestamp format for the date and time. Here are the results of that query:
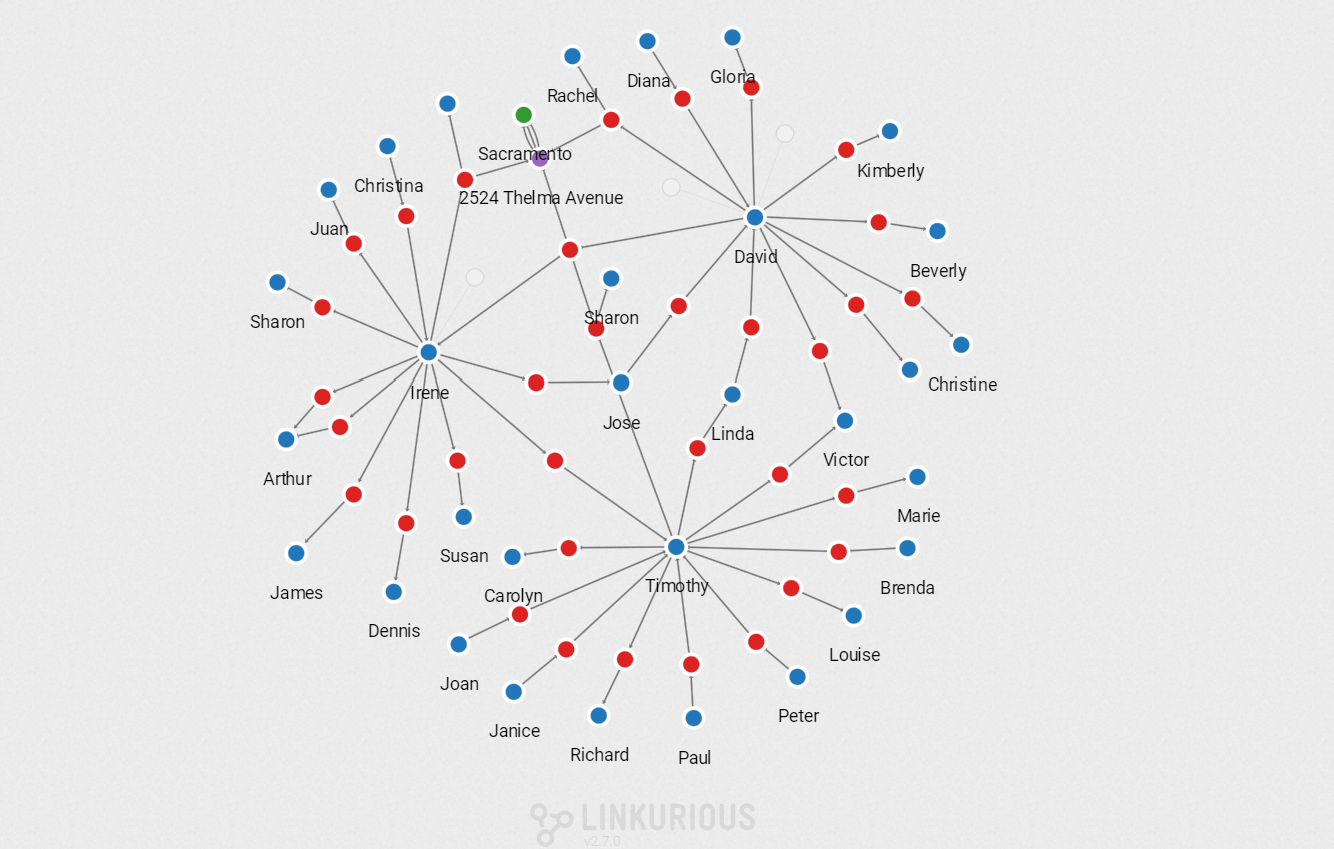
The query gives us 3 calls. With a simple click, we can expand further the connections to display more data about these calls, namely the callers. They all have made a phone call in the vicinity of our crime location. The only problem is that we have multiple names. Is one of them our perpetrators?
Let’s say that as a police investigator the names is the list of suspects do not ring any bells. We need further digging to identify our perpetrator. We could interview the different suspects and check their background but we are going to use data to speed up our investigation.
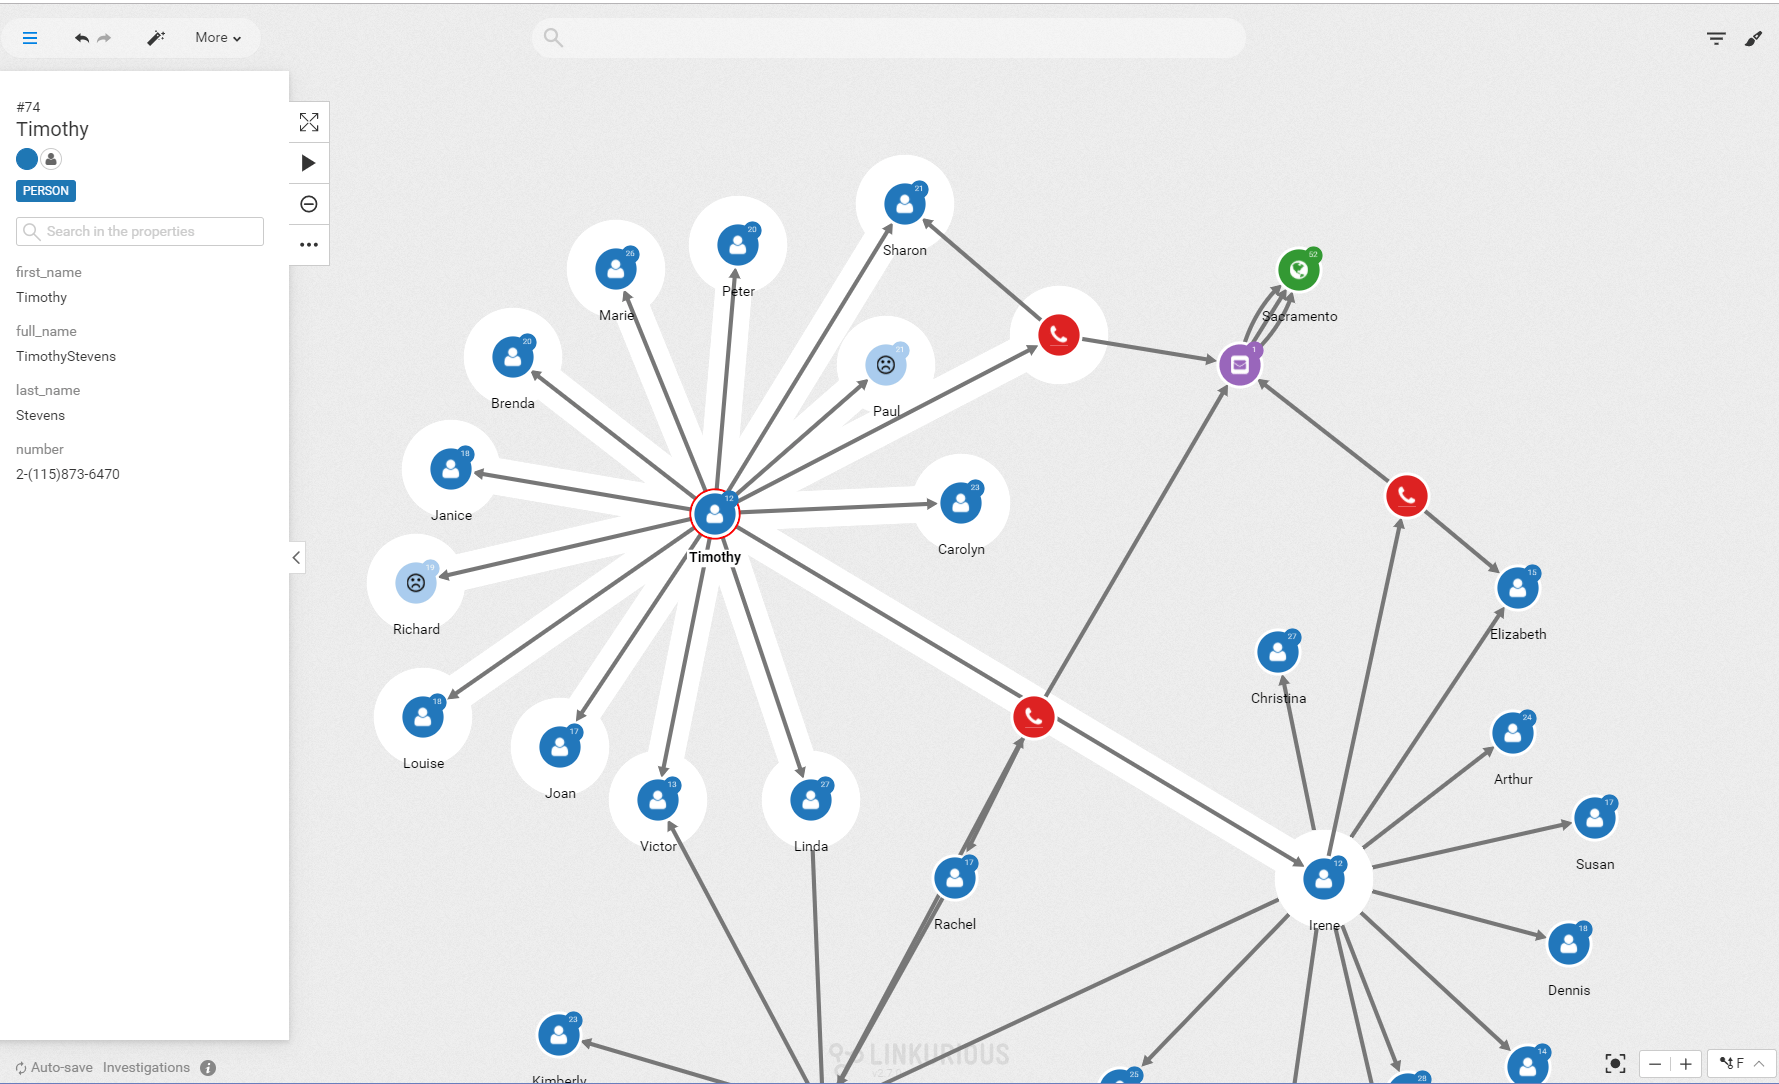
That search can be done in a second in Linkurious Enterprise. We simply have to double click on the suspect nodes to expand their network of relationships.
To make the visualization more useful let’s enhance the data quality with more information. We are going to create a direct relationship called “KNOWS” between everyone who shares a phone call. This way we will display fewer data and it will be easier to analyze what is left. We can use another query template to achieve this:
MATCH (n), (b) <br/>
WHERE id(n) = {{“Caller”:node}} AND id(b) = {{“Callee”:node}}<br/>
CREATE (n)-[r:KNOWS]->(b)<br/>
RETURN n, b, rHere is how the new graph schema looks like:
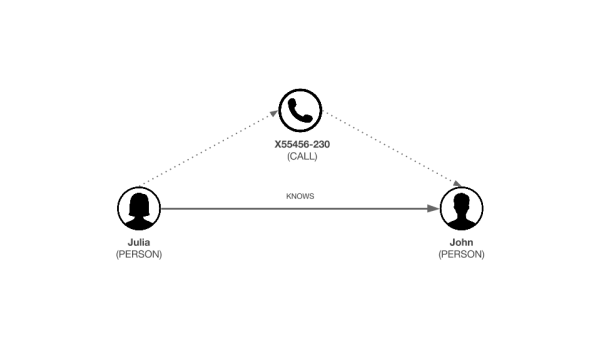
And here is how it looks like for the investigators in Linkurious Enterprise:
We can now display only the direct “KNOWS” relationships to get the network of our 3 suspects and the people they have been in touch with.
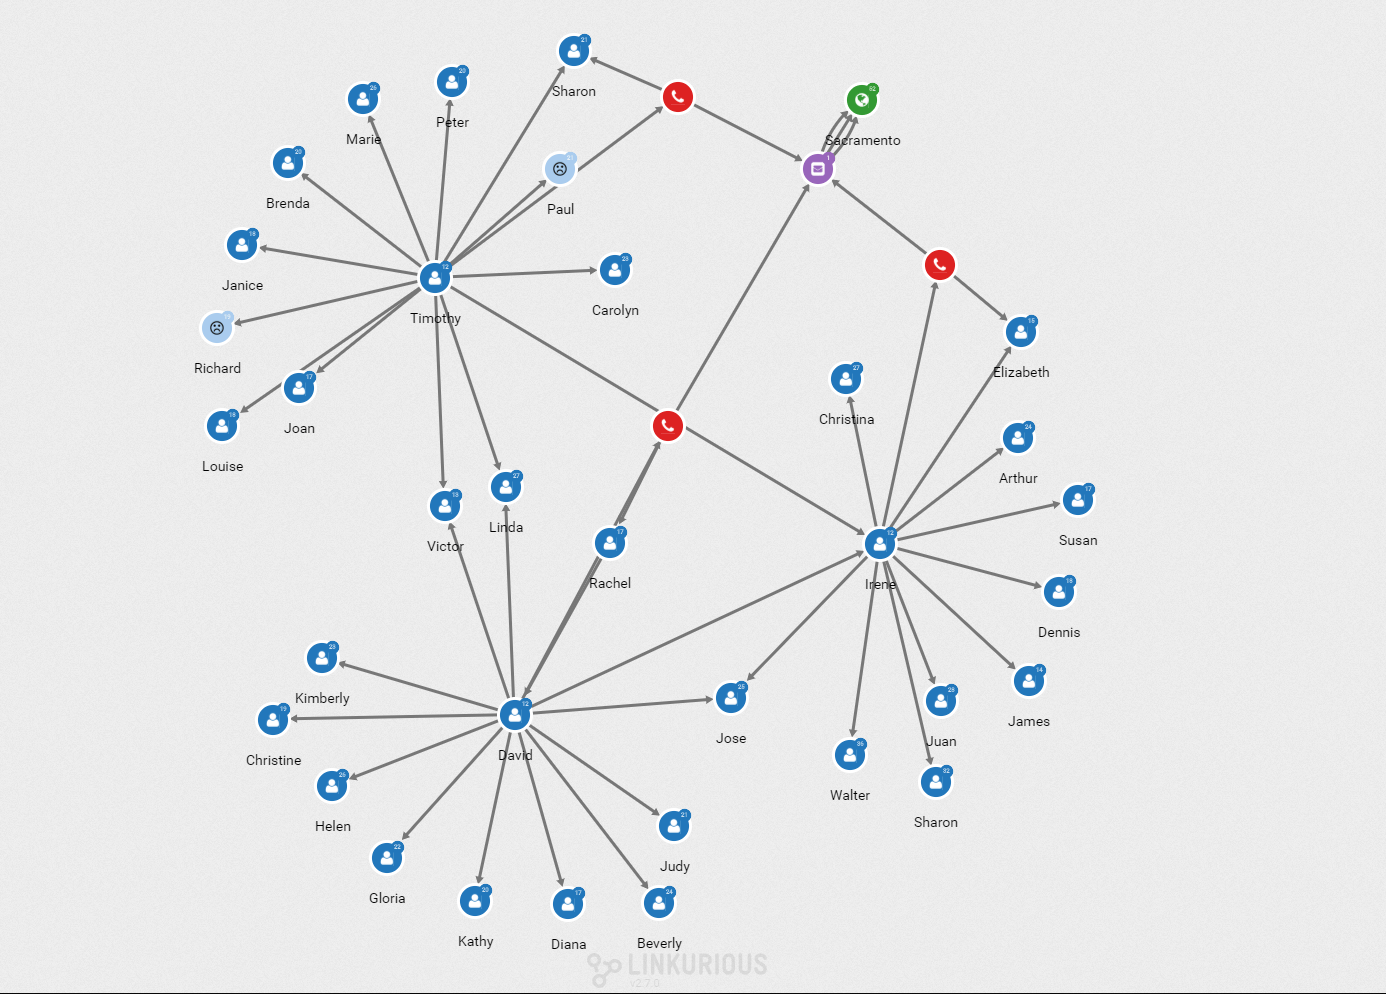
I can select one of the suspects to see his connections highlighted.
As a police investigator, we are going to assume that we recognize a few names that have already appeared in other investigations: Paul Sims and Richard Greene.
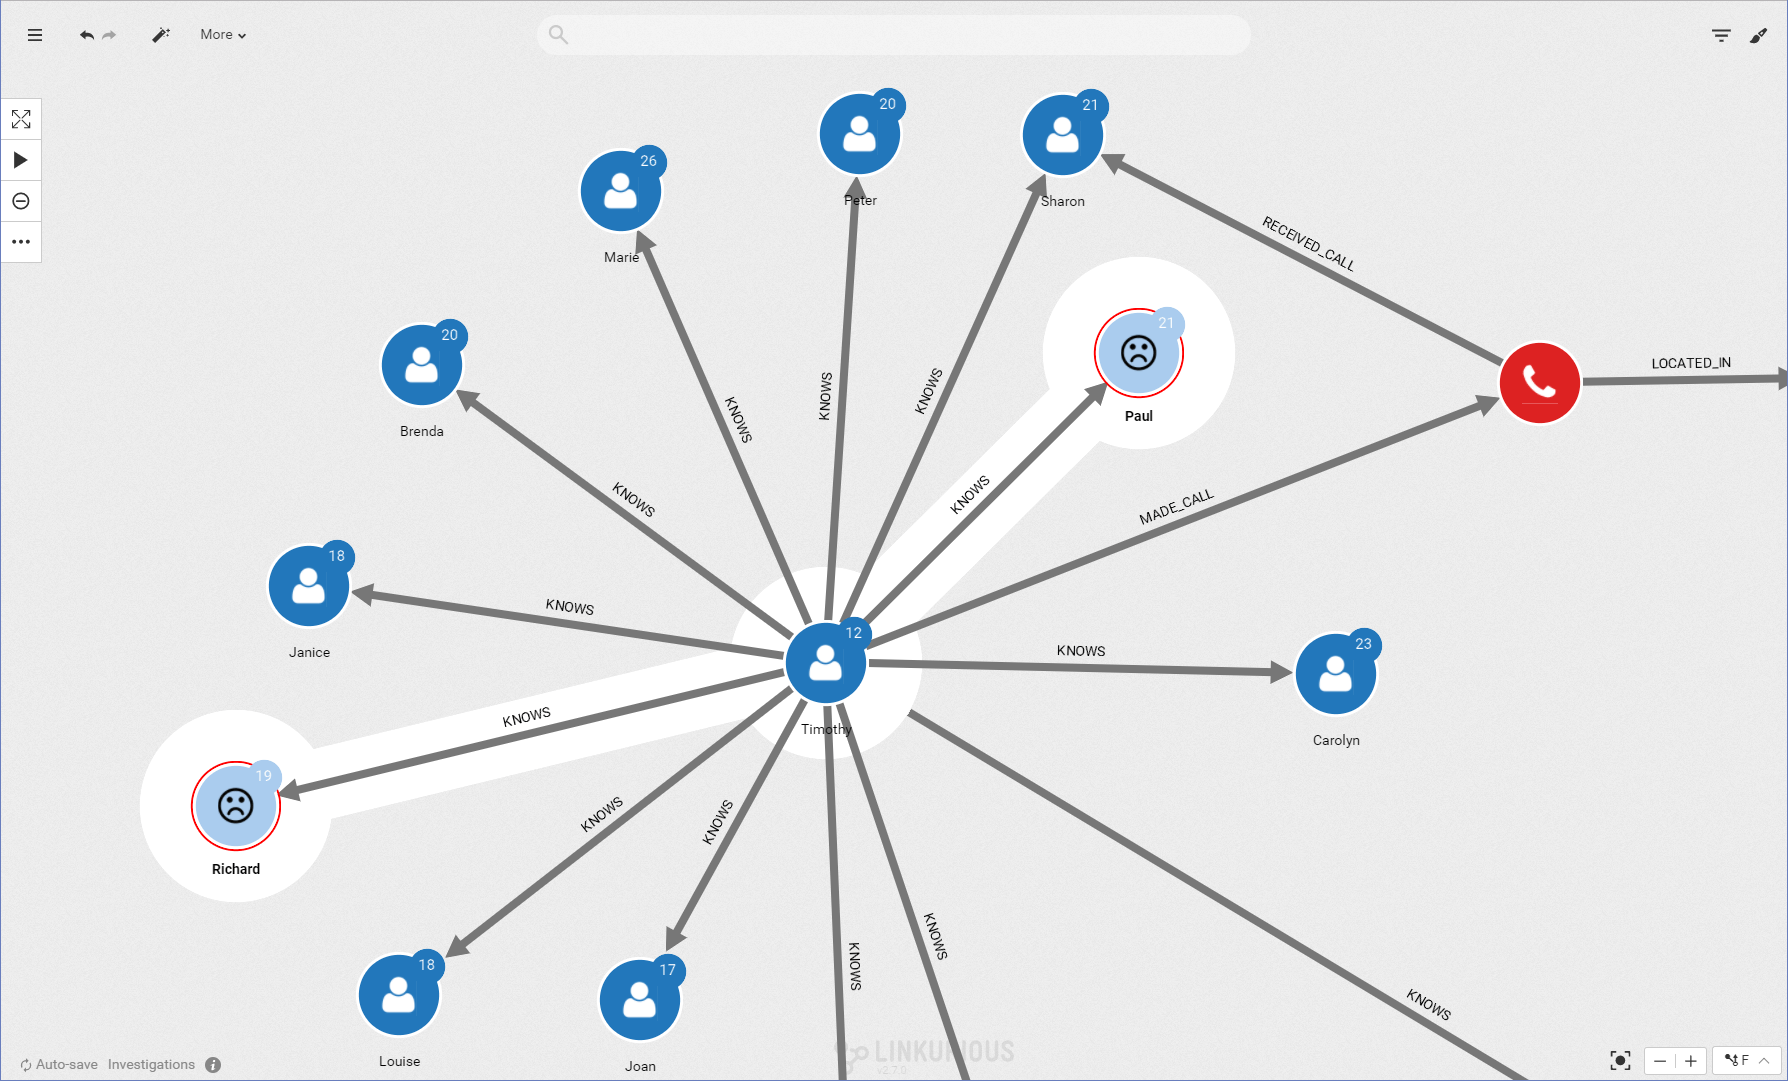
These people are not directly tied to the crime we are investigating but they are in contact with someone who is. Visually we can investigate that connection.
The phone call analysis shows that Timothy Stevens is connected to two known criminals: Paul Sims and Richard Greene. They are part of a small community within the larger graph. Among our initial suspects, Timothy Stevens is the most likely to be a criminal. We should focus our investigation on him.
In a few steps, we turned our lines of call records into one specific insight : Timothy Stevens is the likeliest suspect in our criminal investigation. In order to achieve that result, we simply used the power of graph analysis.
Police investigations is one of the fields where graph analysis is used, together with more traditional techniques, to discover insights in complex data. Graph technology offers a complementary approach when it comes to understanding relationships within connected data. To help investigators find insights, platforms like Linkurious Enterprise offers various investigation features to easily work with graph data.
A note about Ashley Englefield
 Ashley Englefield is a 13 year veteran of a Law Enforcement Agency in California. Prior to becoming a police officer Mr. Englefield was a United States Marine and obtained a Bachelor degree in Information Systems from California State University Sacramento as well as a Masters degree in Criminology from Cambridge University (UK). He then joined the Detective division and worked as an investigator in narcotics, gangs, and eventually the homicide division where he gained expertise in conducting investigations into cell phones, cell phone records, and many aspects of internet-related technologies.
A spotlight on graph technology directly in your inbox.