Linkedin‘s vision is to create economic opportunities for the 3 billion people in the global workforce. Today, Linkedin is starting a competition to discover the best ways to use its data to make that vision a reality.
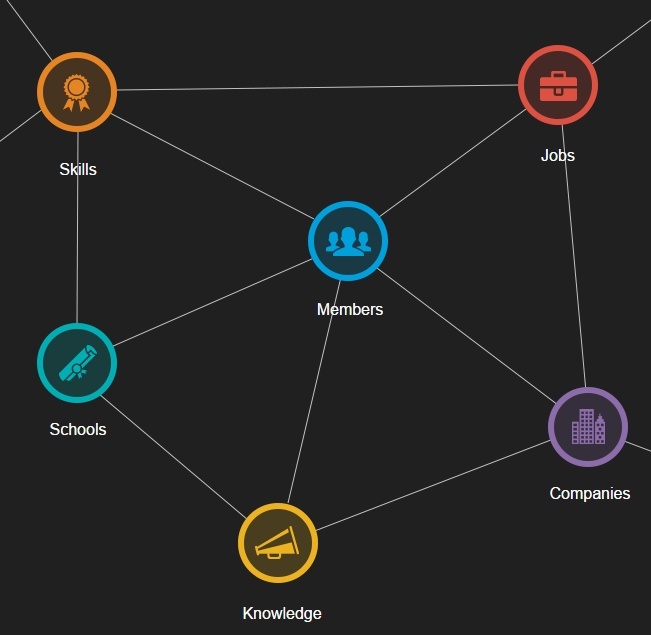
Linkedin has been vocal about its love of graphs. Its CEO Jeff Weiner explained that his company’s vision is to build a digital mapping of the global, the Economic Graph. Linkedin is not just a collection of resumes. Its users have built a rich dataset of skills, people, schools, companies, jobs or knowledge. All these entities are linked together and form the rapidly growing Economic Graph.
Linkedin uses this data today to recommend jobs or suggest users to follow. Recently, Linkedin show more innovative uses. It is now offering for example a ranking of the US universities. Linkedin uses its knowledge of career paths to suggest prospective students which university to attend based on their career choices.
There is a lot more to be done with the data Linkedin has. If you ever caught yourself thinking that, now you have the opportunity to do something about it!
Linkedin is starting a challenge to find the most innovative use of its data. Researchers, academics and data-scientists can submit proposals for research projects. The projects must combine :
- Novelty: Takes into account the thoughtfulness and originality of the entry, including its unique approach to taking advantage of data from the Economic Graph.
- Impact: Considers the potential benefits to the region, country and the world, as well as the extensibility of the proposal.
- Feasibility: This criterion will weigh the practicality of the submission, measuring the likelihood it can be researched and implemented within a reasonable time period and the types of data from LinkedIn that will be necessary for the proposed research.
Up to 3 candidates will win a $25 000 research award. Submissions are opened until December 15, 2014. Good luck to the contestants!
How would you propose to use the Economic Graph data to create more economic opportunities?
A spotlight on graph technology directly in your inbox.