The latest Ogma release is rich in new features, improvements, and examples to help you build clearer and fancier graph visualization applications. Visual transformations and interactions around grouping features is a big theme in Ogma 5.2. We focused on features that help declutter large and complex graph visualization and provide more insightful experiences with the introduction of in-place expand and collapse, grouping in geo-mode, a faster layout, and more. Bent edges are also now available in the hierarchical layout to make your visualizations more readable.
The Ogma playground also got a big facelift to better suit your needs and enable developers to work around prototypes more quickly and hassle-free. And, unique to Ogma, a new Oracle parser lets you visualize your Oracle data as a graph.
Read on for all the latest in Ogma 5.2.
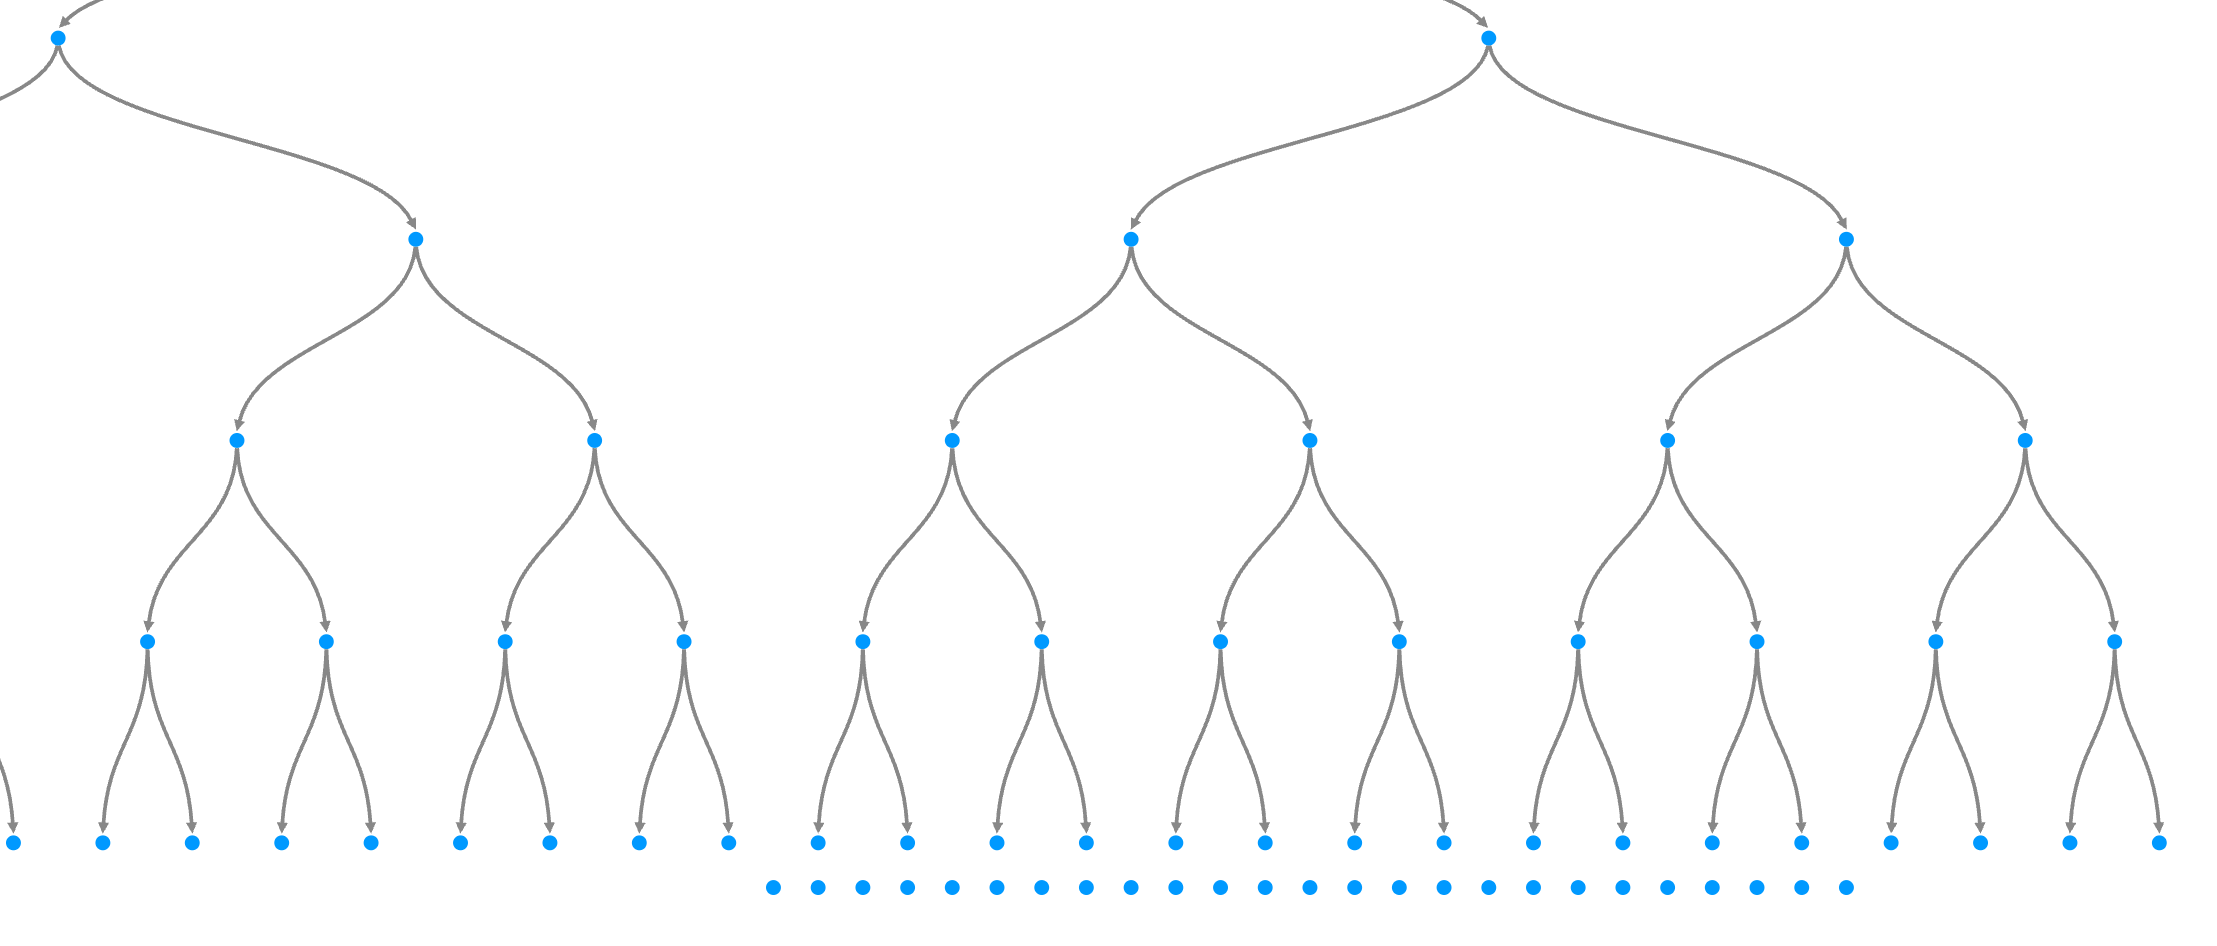
You asked and we answered: bent edges are here! In hierarchical layouts where layers have a lot of nodes, straight edges can quickly become difficult to read.
Now, with bent edges, hierarchical graphs are much easier to consume. Natural bundling between edges and more white space make even your largest hierarchical graphs readable.
If you’re working with a particularly complex graph visualization, you may want to dig into the contents of a certain group within the graph. You may also be less interested in certain groups and wish to minimize them within the visualization.
With in-place group expand and collapse, this just got easier than ever. Now you can expand or collapse any grouping without losing your layout. This new feature can be used with any visualization that has clusters, allowing you to stay focused on the parts of your graph that matter most to you.
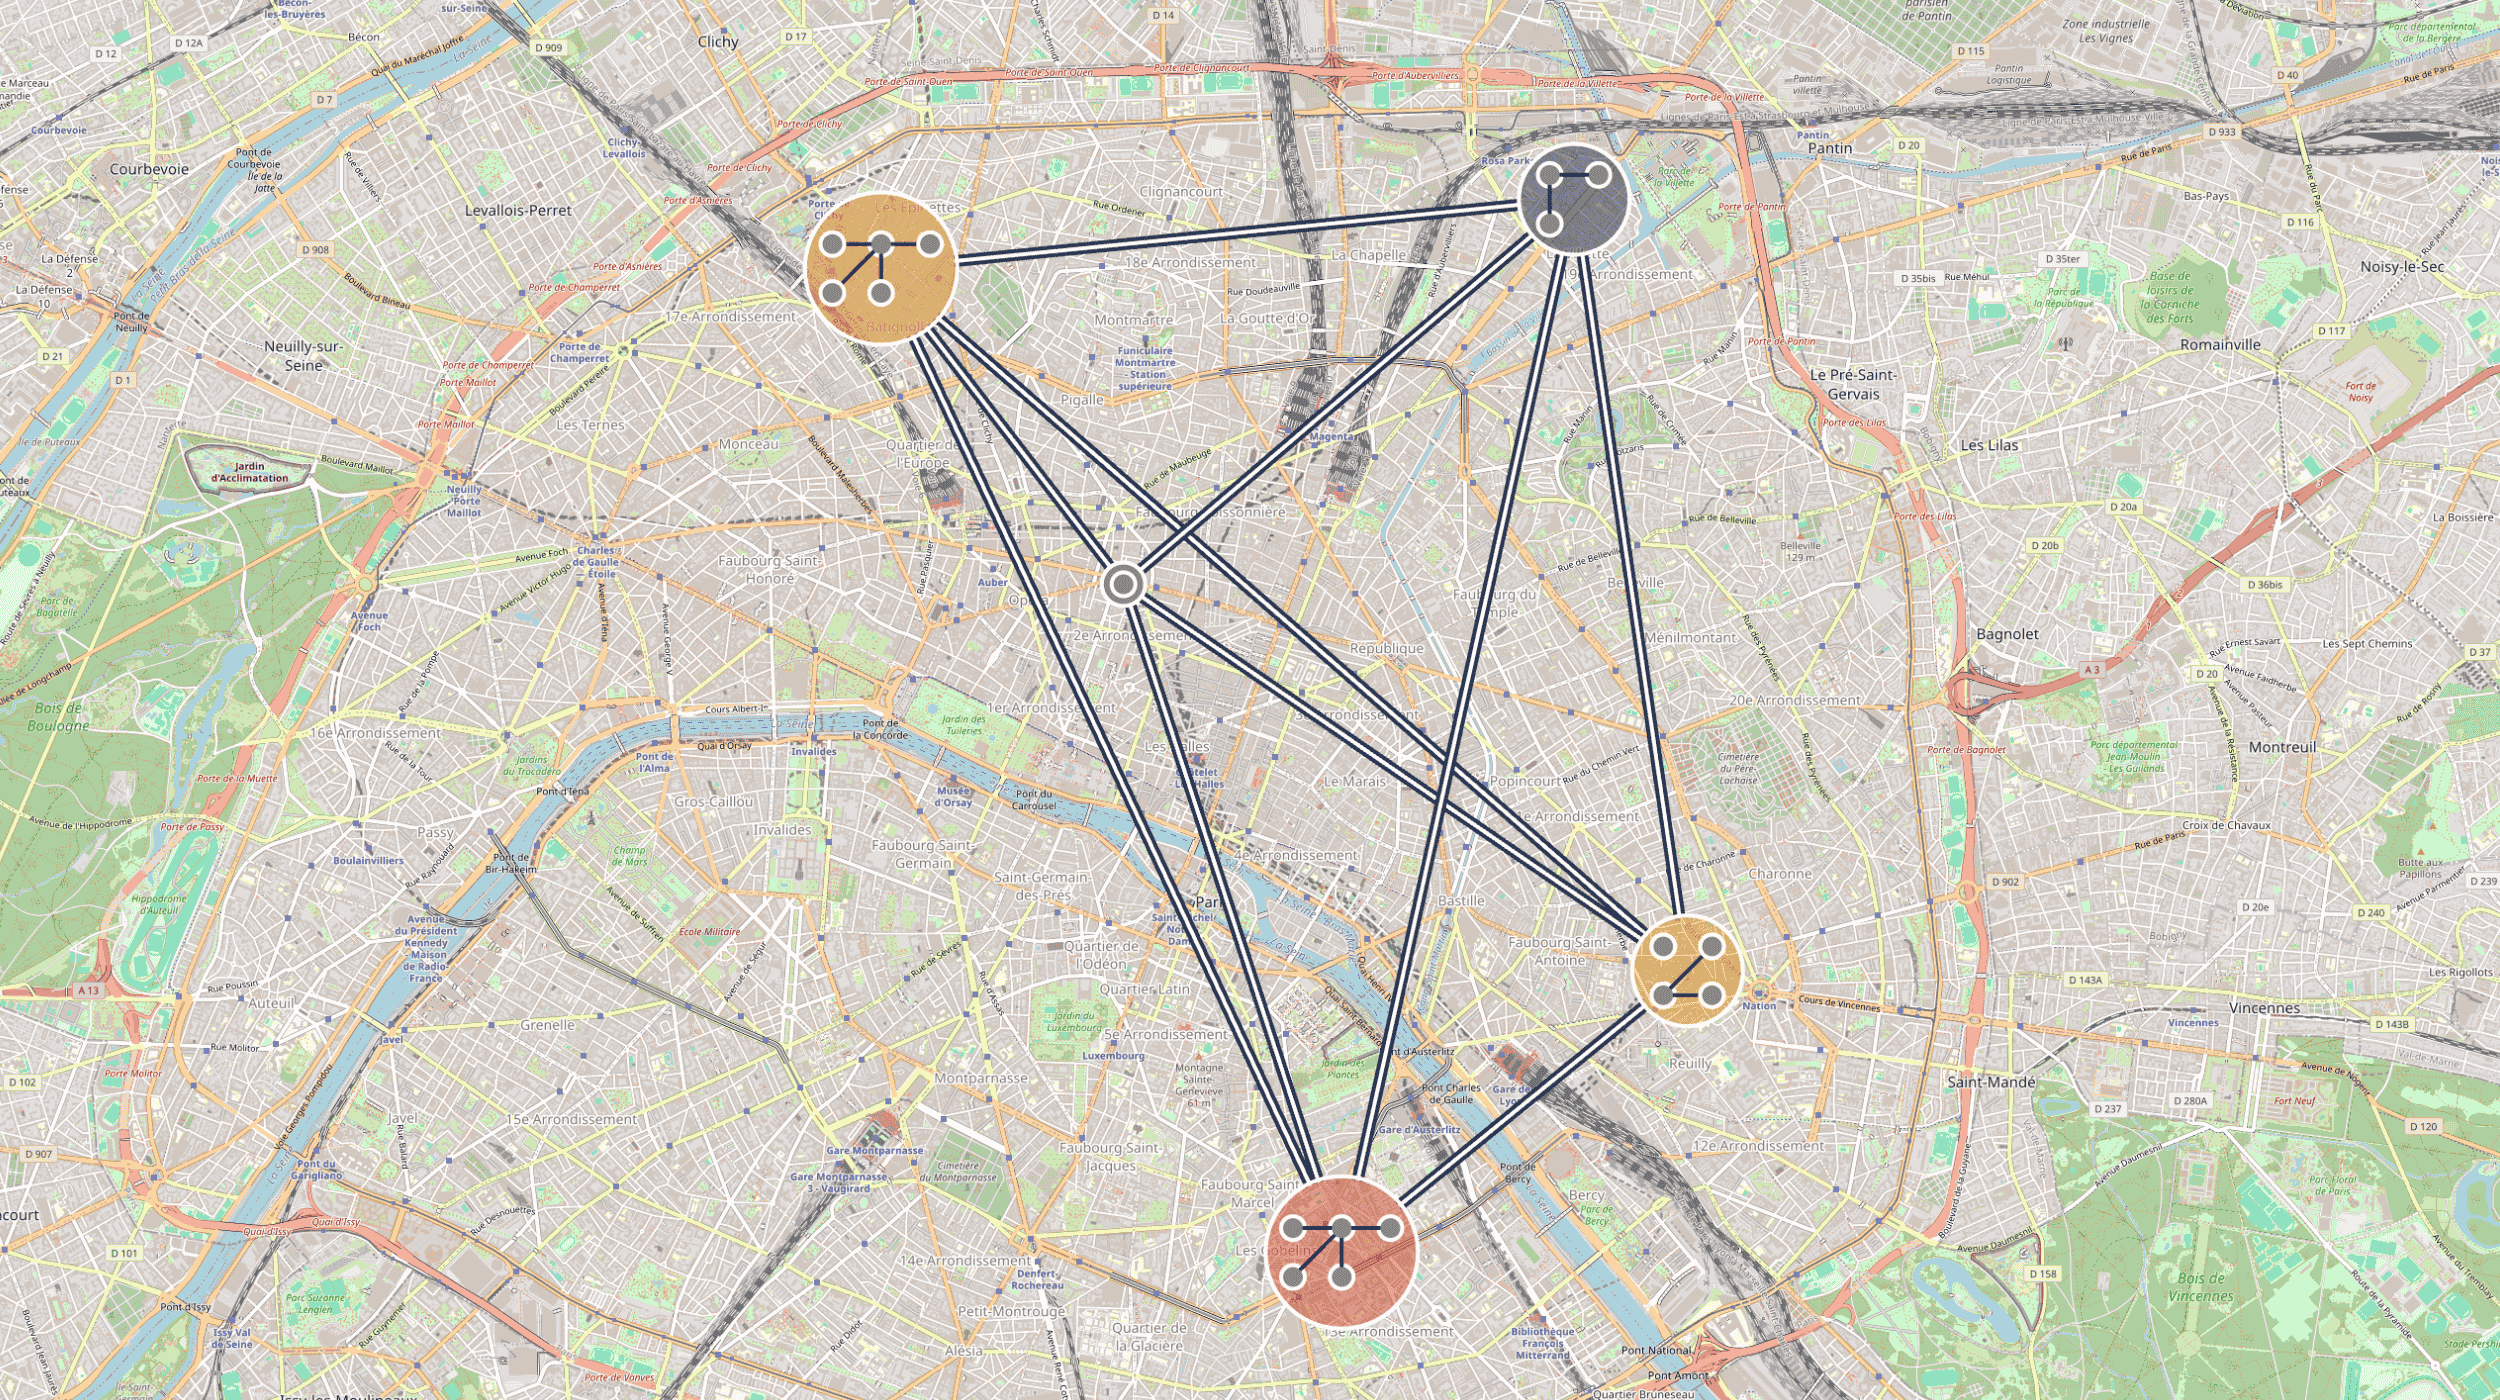
With this innovative feature, you can group your data in geo mode, mixing spatially referenced data with abstract data. For example, you might mix the location of a business with the structure of that business’s departments. Or, if you are working in manufacturing, you can now more easily visualize the location of components.
If you’re using grouping in your visualization with lots of small groups, it can sometimes take a long time to achieve the layout when you’re working with very large networks. With the release of Ogma 5.2, achieving this layout is 5x faster thanks to replacing calculations with pattern matching. Not only can you save time but, with Ogma 5.2, you can benefit from better readability.
Finally, you can now experience smoother animations in grouping and see improvements in how animations happen in sequence. This offers a better user experience when working with clustered groups.
The latest version of the Ogma playground offers several changes to make your experience more enriching, starting with a new and improved user interface with updated menus. The playground can now be used on mobile. We have also made updates to bring the playground in line with the most modern JS standards.
But the biggest change is that we have made it very easy to use external libraries in the playground. Although this was possible previously, it wasn’t a simple process. Now, it’s a snap to bring in an external library to begin prototyping quickly.
If you want to have graph visualizations from Oracle database, good news: you can now use the Ogma Oracle Parser to render visualizations of your SQL Property Graphs in Oracle Database 23ai in minutes. The new Parser uses the SQL/PGQ standard (ISO/IEC 9075-16:2023) to communicate with the database and allows you to display interactive graph visualizations and easily traverse connections in data. Learn about how to get started with the Ogma Oracle parser on Github and on our documentation site.
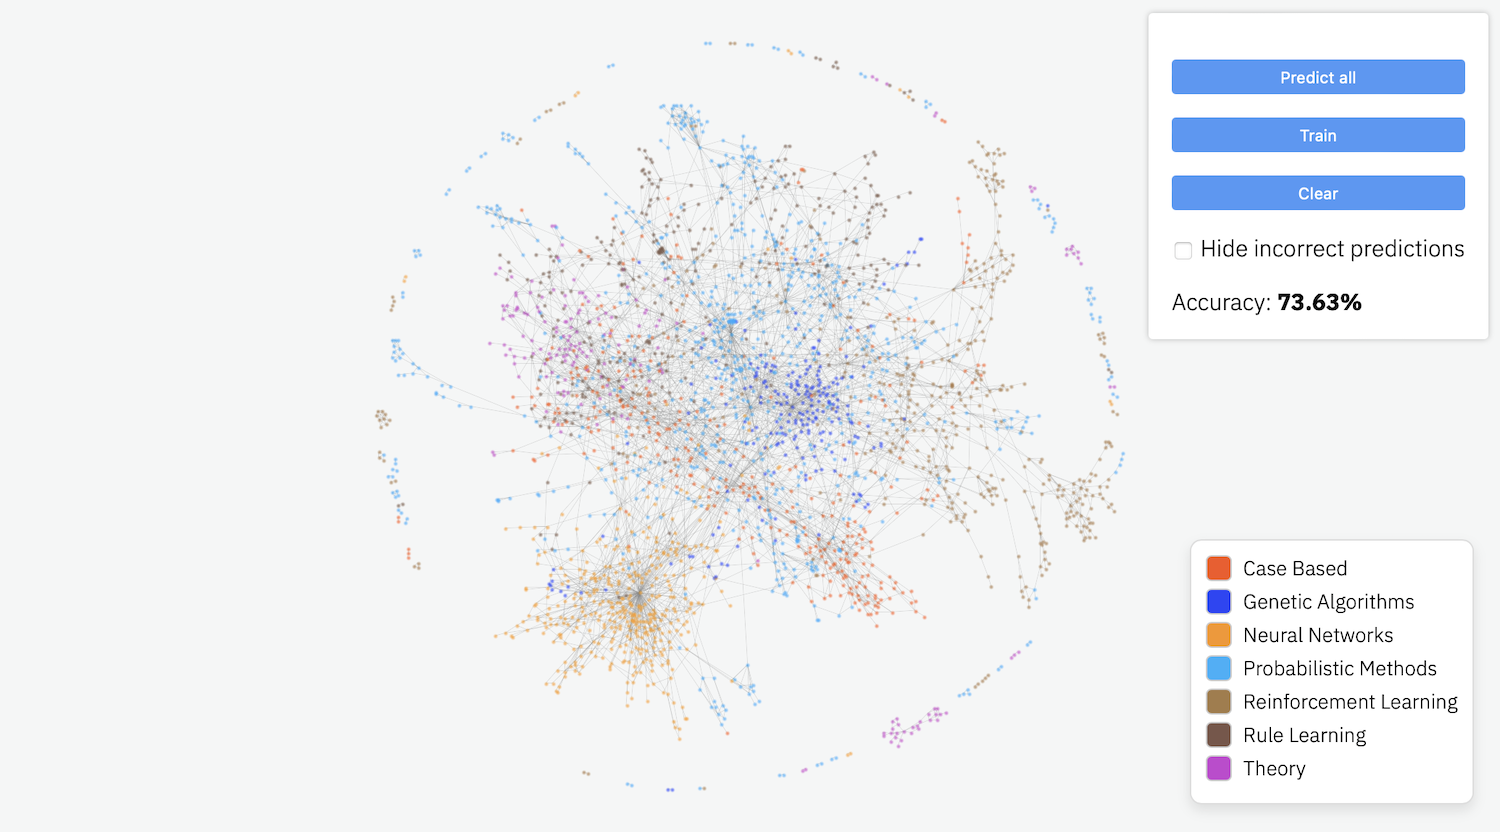
We’ve published a new example demonstrating how to use AI as an aide in graph visualizations for classifications, clustering, and predictions. We show how very small AI models can be used in working with a visualization, as a support for human intelligence. In our example, AI acts as a tool to turn users’ attention to elements in the graph that might merit attention, effectively acting as an aide to the people working with the graph.
A spotlight on graph technology directly in your inbox.