The Sentry is an investigative and policy organization that seeks to disable multinational predatory networks by pulling back the curtain on wars, mass atrocities, and other human rights abuses.
They recently launched Atlas, a public-facing, interactive open data tool that aims to shine a light on the networks that benefit from violent conflict, repression, and kleptocracy.
Atlas marks a new step into the world of open data for The Sentry. It puts relevant data directly into the hands of journalists, policymakers, financial institutions, and the general public to help expose violence and corruption. With this mission in mind, the team decided graph technology would provide the right tools for the job. Read on to take a deeper look at what Atlas is, how it was developed, and why the team at The Sentry chose a graph approach to make this resource available to researchers and the public.
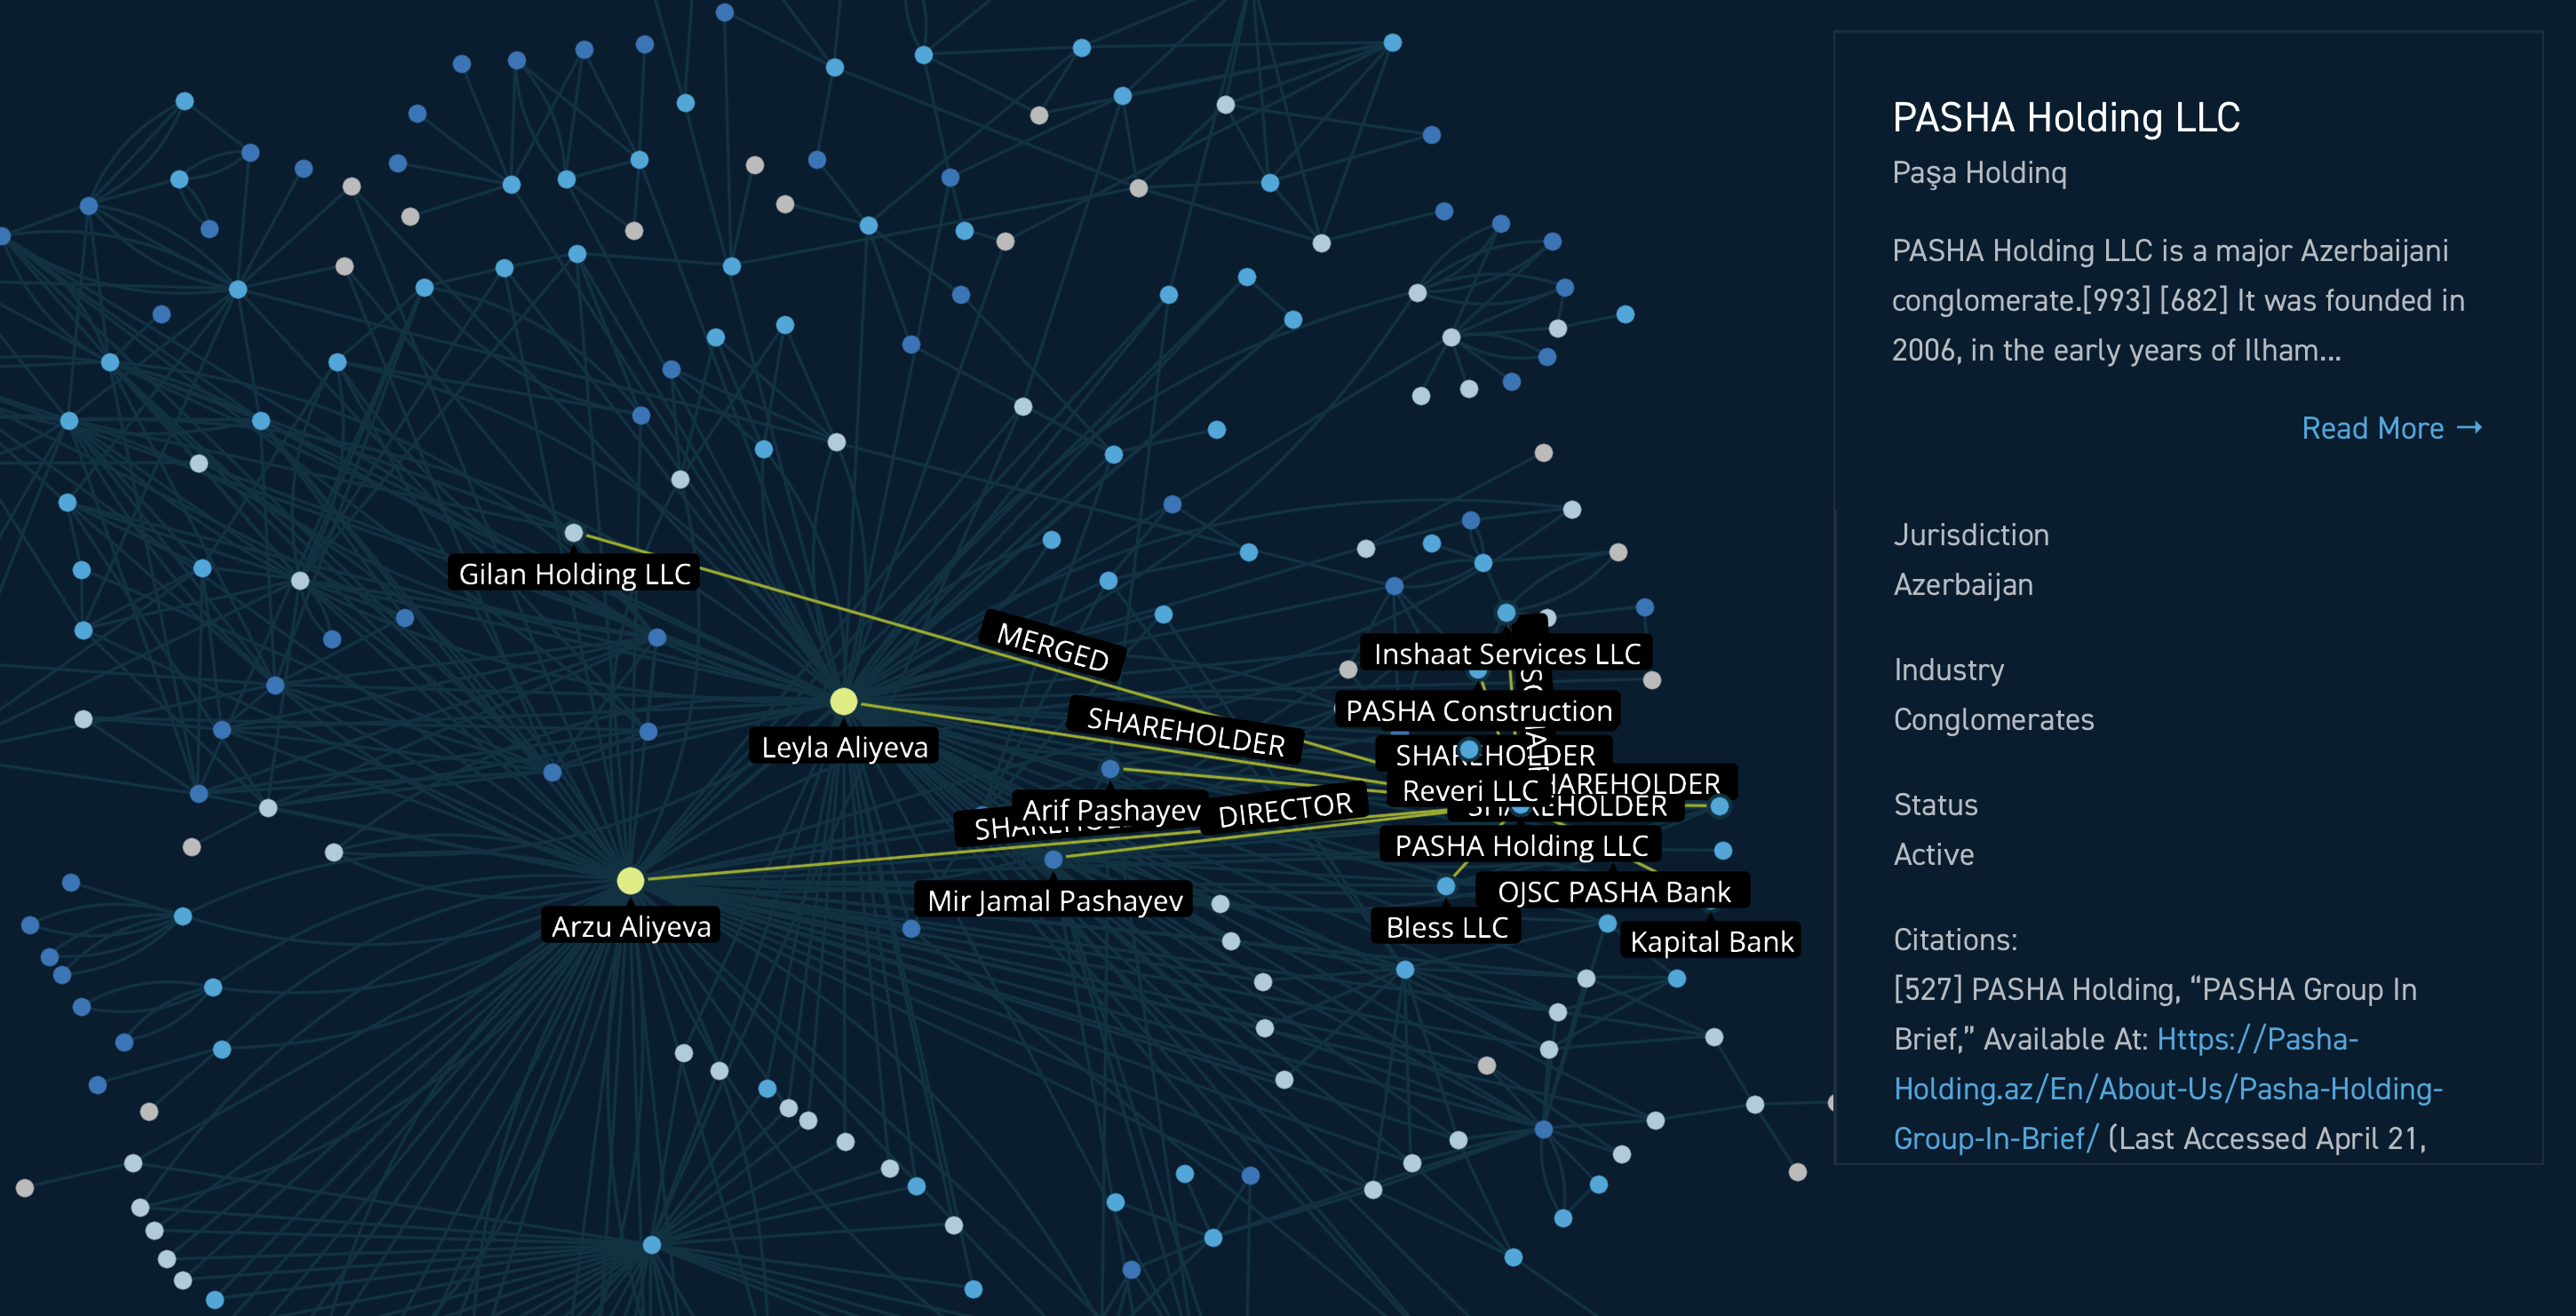
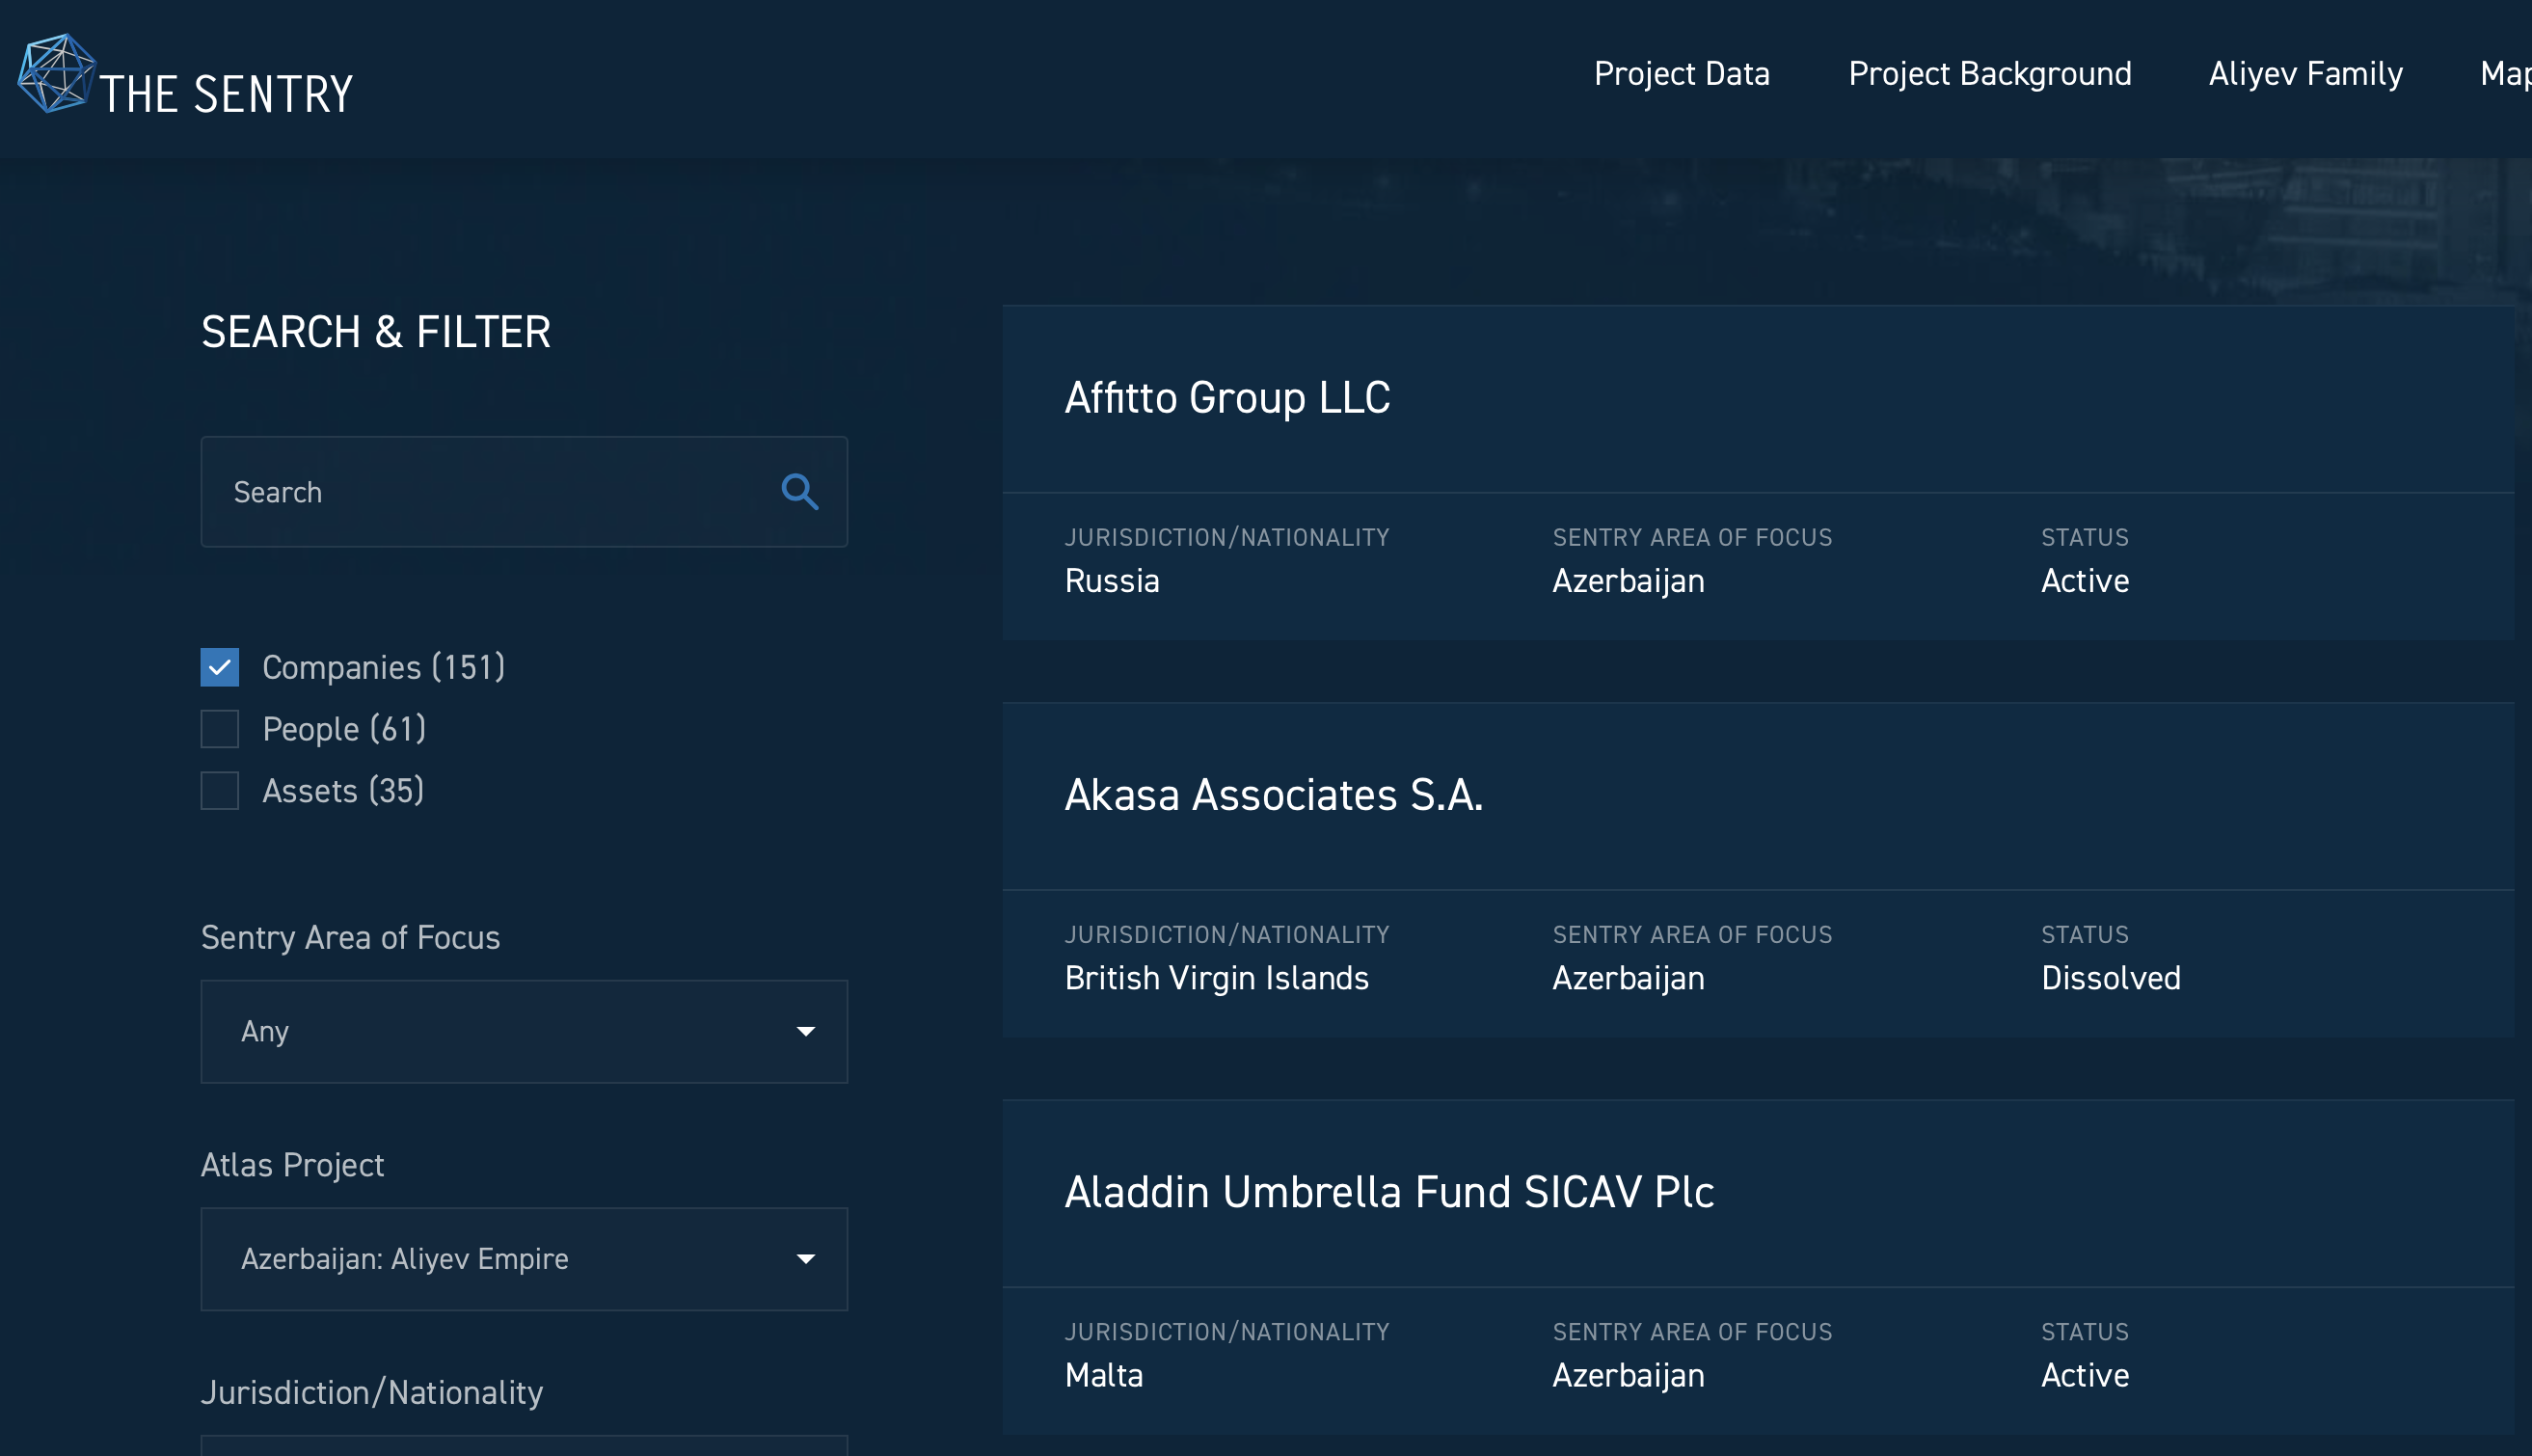
Atlas offers researchers and the general public access to curated, carefully researched datasets related to specific networks of influence and corruption. It provides users with multiple ways in which to view the data and insights. This includes a wiki-style directory with context and research citations related to entities of interest, and a network visualization feature, powered by Linkurious’ Ogma graph visualization library, that can be explored dynamically.
As of the time of this writing, there are 2 datasets available in Atlas:
- Relationships around the daughters of the Azerbaijani president and their vast fortune,
- Connections around the sprawling corporate holdings of South Sudan’s first family.
Multiple other datasets are planned for release in 2025.
Prior to releasing Atlas this year, The Sentry focused on publishing highly researched reports on the networks of grand corruption that fuel wars, mass atrocities, and other human rights abuses. While the organization continues to produce these high quality reports, Atlas marks a new direction for the organization towards the world of open data.
The Sentry saw a need for this kind of tool. Traditional, private-sector data providers don’t supply all the links researchers or financial institutions might need to draw informed conclusions in their research or business decisions. For example, a distant relative of a person of interest might be deemed too distant by a data provider, when in fact the relationship provides important context.
There was a demand from law enforcement agencies, sanctions officers, etc. for more complete data related to corruption. “We wanted Atlas to be a place people can come back to again and again,” explains Michelle Kendler-Kretsch, Investigations Manager at The Sentry. “Today, a researcher may be working on the bottom corner of the network, and 6 months later they might be digging into another part to understand the deeper connections within.”
The entire datasets available within Atlas are public, so users can recreate the networks within their own tools or combine them with their own data. “We want to be part of the building blocks of research into networks,” says Michelle Kendler-Kretsch.
The team was already very familiar with graph technology, having already used the Linkurious graph analytics and visualization software to perform their research for several reports. For this project, to go beyond simply providing interesting datasets, The Sentry wanted Atlas to be an interactive tool accessible for everyone. To build this, they used the JavaScript graph visualization library Ogma that can be used to develop expressive and interactive large scale graph visualizations.
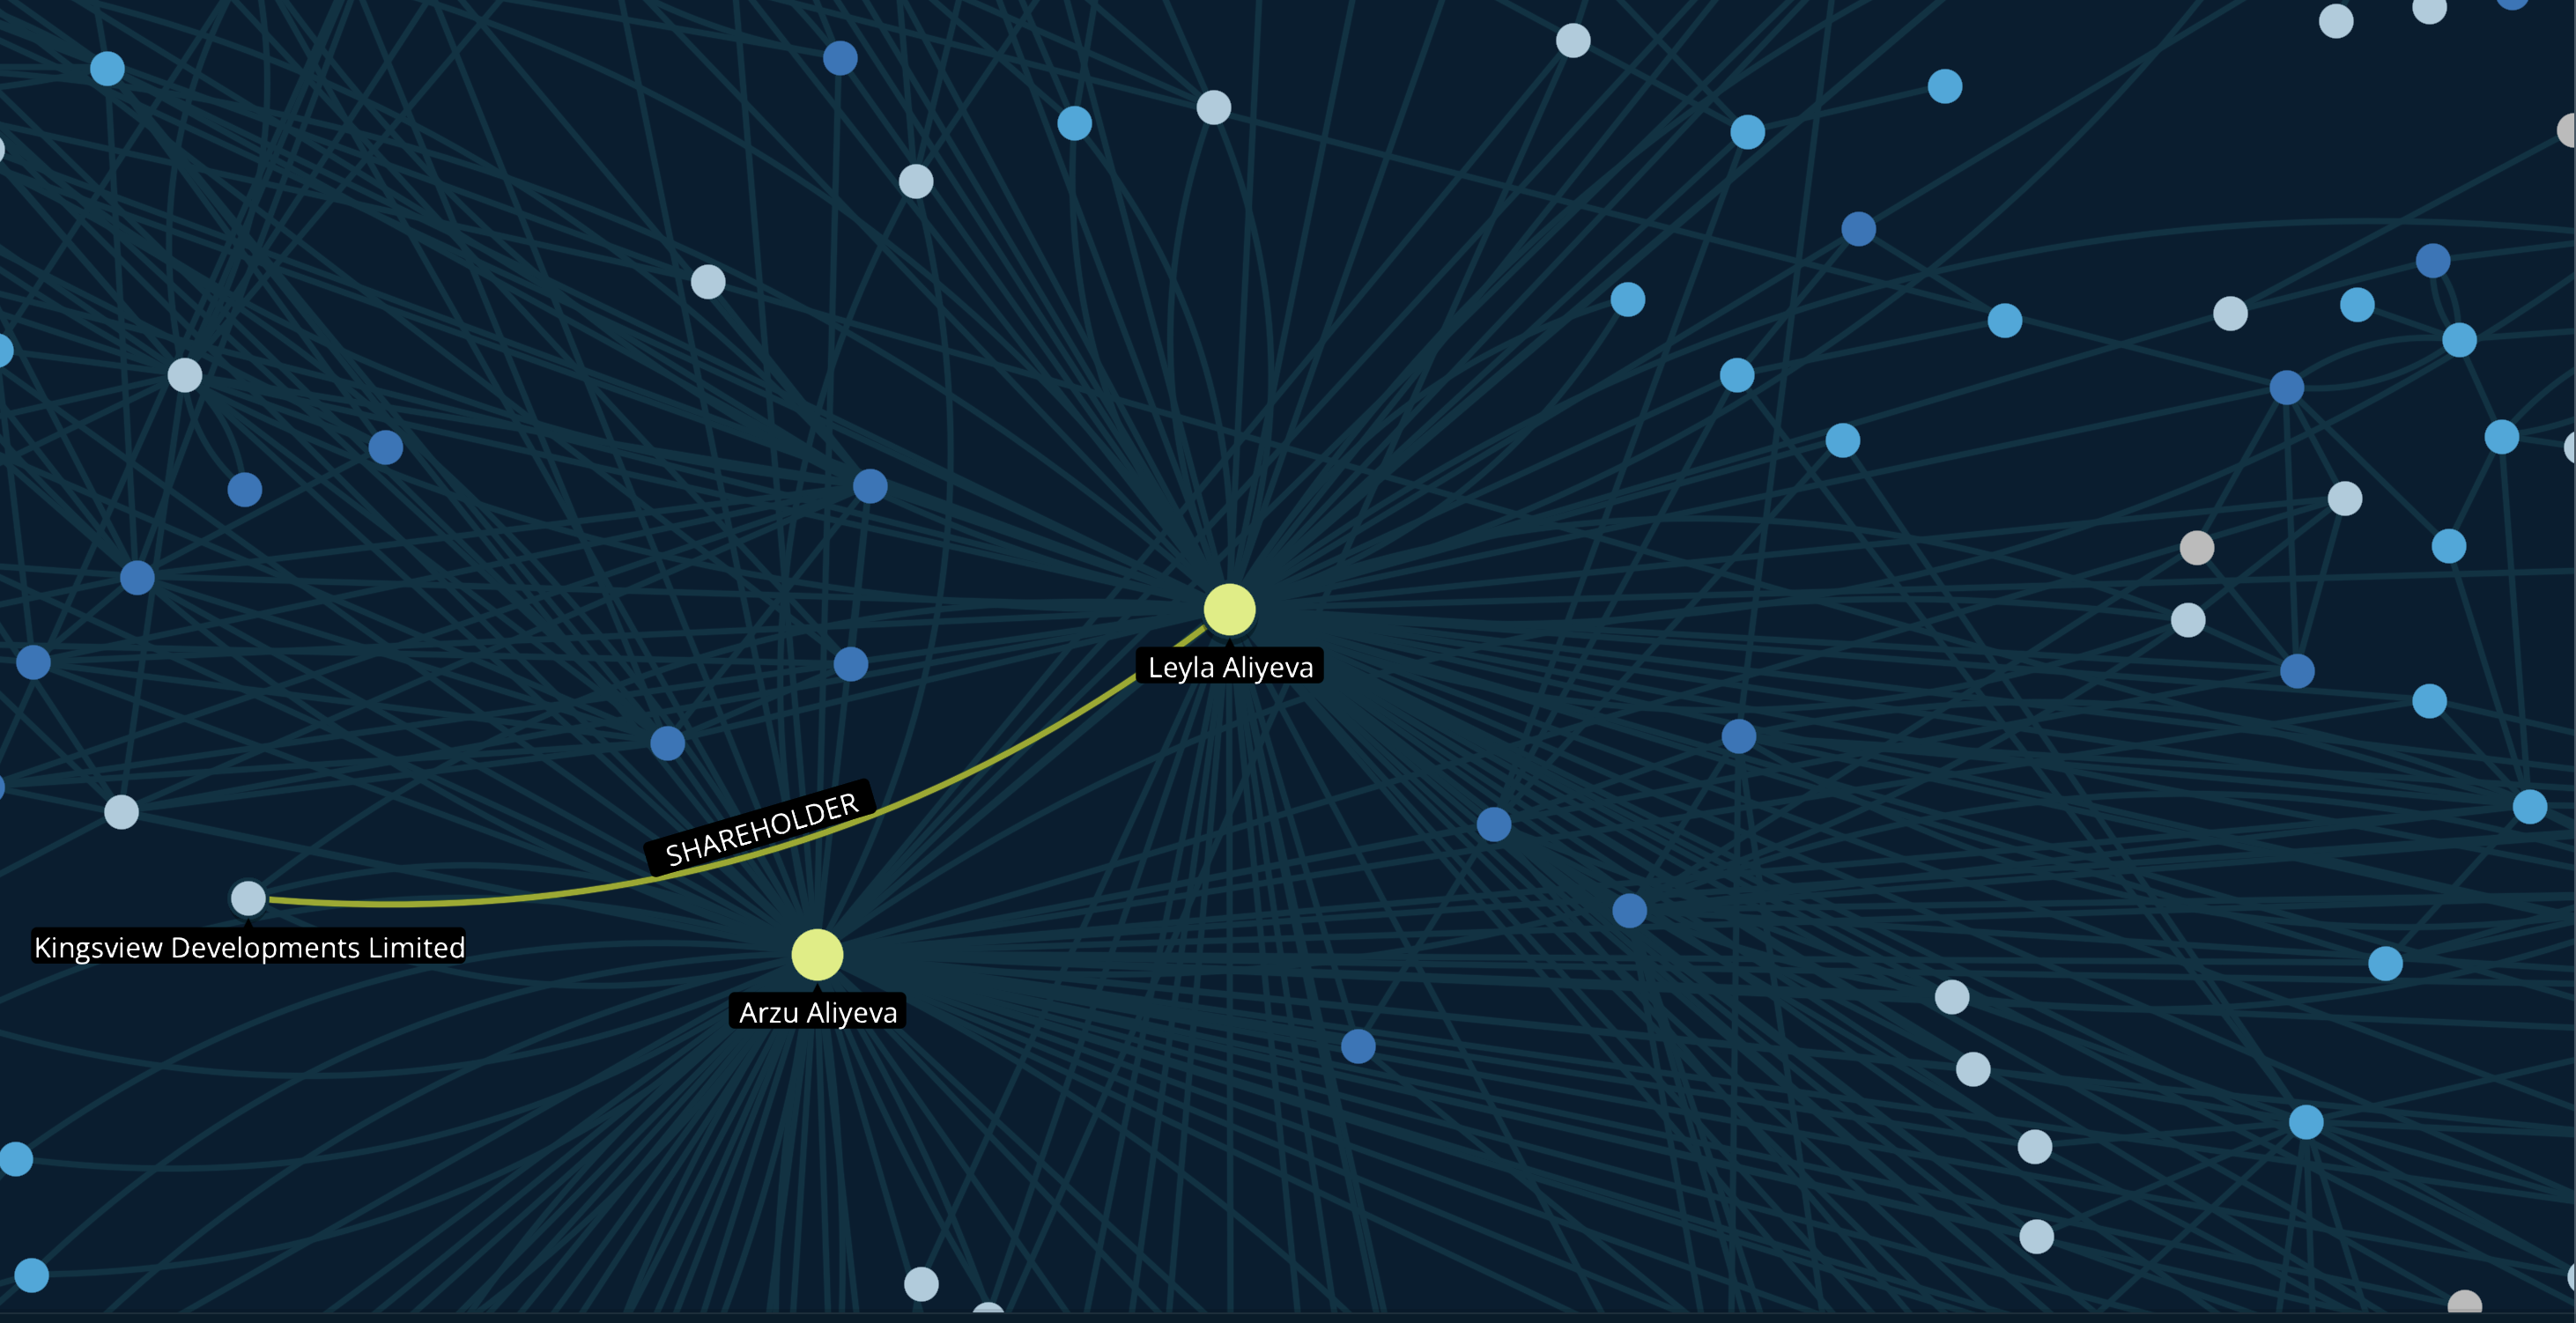
Graph visualization provides an intuitive way to represent even very complex networks of connected data. It’s a practical way to thoroughly explore the kinds of networks of influence and corruption The Sentry works with. For this reason, the team at The Sentry felt that having a visual component to their open data tool was essential.
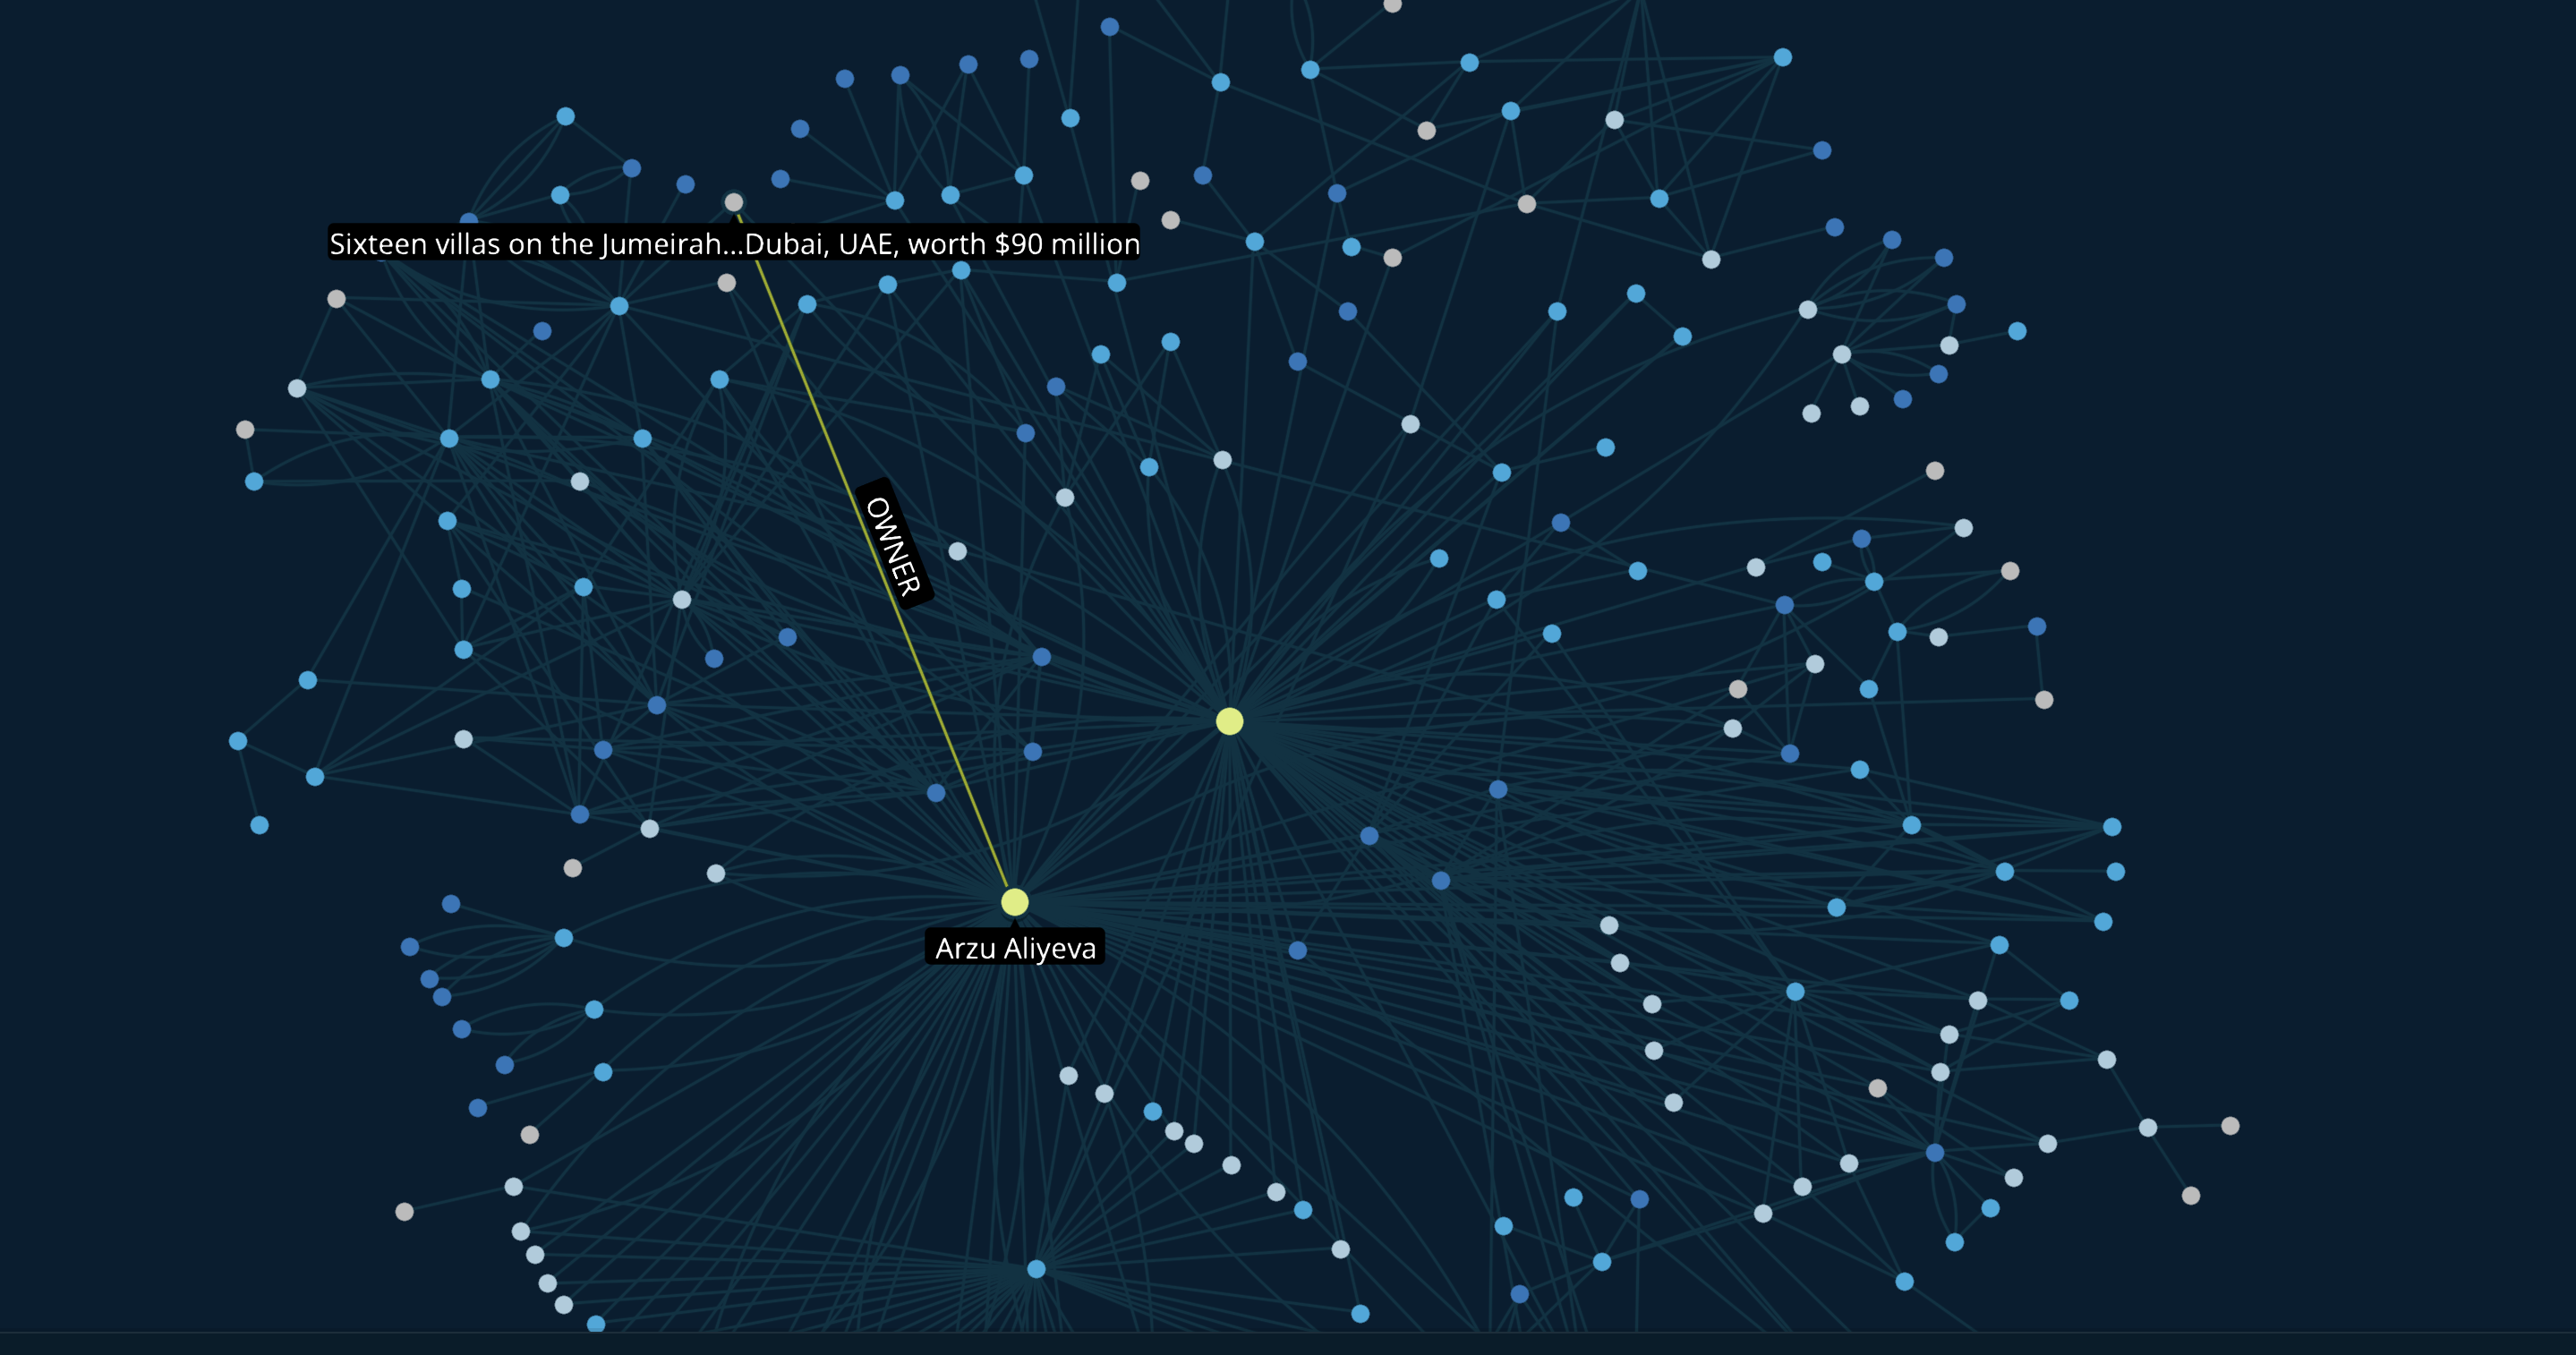
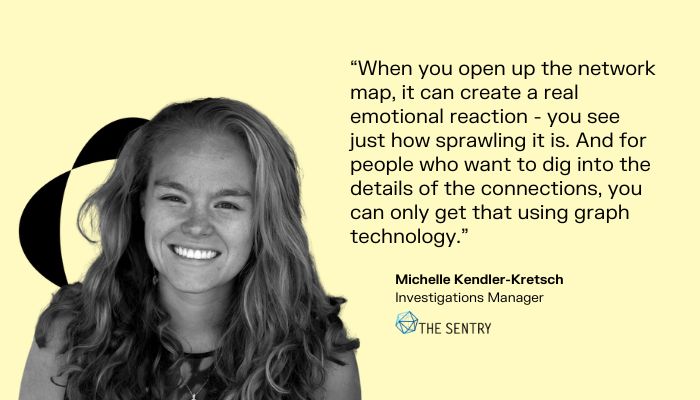
“When you open up the network map, it can create a real emotional reaction - you see just how sprawling it is,” says Michelle Kendler-Kretsch. “And for people who want to dig into the details of the connections, you can only get that using graph technology.”
Graph visualization is also a powerful storytelling tool. “A lot of these elites have gone through a lot of trouble to separate themselves from shady activities. Even though it can be hard to follow, you can understand why it’s a problem. You see all the layers and paths through the network.” She also notes that graph can empower specific and intentional storytelling by leading users through certain paths of connections through the network map.
Although The Sentry’s team had already used Linkurious graph analytics and visualization platform for their own research, getting up and running with a JS graph visualization library required rethinking their data schema in a way that would make more sense for a public facing tool. They built a new database using their new schema. Since the average user is more comfortable working with nodes rather than edges, they also decided to create biographies on the nodes in their database. The information within the nodes has been carefully backed up with references to make it more powerful for researchers.
In parallel, they also built out entity profiles on wiki-like pages that users can explore like a directory.
The end result was something visually stunning that also had a great deal of detail. The Sentry’s team wanted a balance of functionality and beauty, and with Ogma they succeeded in achieving that. “We were really impressed with everything we could do. Using Ogma to build Atlas was not only functionally better than we anticipated, but also just aesthetically beautiful, which holds a whole different type of audience’s attention,” says Michelle Kendler-Kretsch.
Beyond simply getting their tool up and running, The Sentry wanted to be sure Atlas would be sustainable. That meant making sure it would stay up to date.
The json files used to develop Atlas let them create the wiki-style directory. They were able to automatically generate separate pages for all of the hundreds of different nodes. If they need to update any information, the team can do so in the json file and it automatically updates the network and the wiki. “This kind of public project needs to be updated to stay relevant, and we wanted to create an actual research tool. In the end, keeping it updated is easy,” says Michelle Kendler-Kretsch.
Atlas has already received a warm reception from its launch. Users see the value in the comprehensive datasets The Sentry has provided. For now, the team is still ramping up on Atlas and working on making more datasets available to the public.
Once the infrastructure and data are fully deployed, The Sentry is eager to make the most of Atlas. They see several possibilities for this tool moving forward. They can use it to dig deeper into past research topics to gain new insights. They can also tell new stories as more data is added and new revelations become apparent.
They may also move towards making a universal dataset available. “There are connections between the stories these datasets tell, even on opposite sides of the world,” says Michelle Kendler-Kretsch. And The Sentry aims to keep telling those stories, and to make it possible for the public to discover them.
A spotlight on graph technology directly in your inbox.
