Our first Neo4j meetup : visualizing graphs with Linkurious and Gephi
Hello everyone,
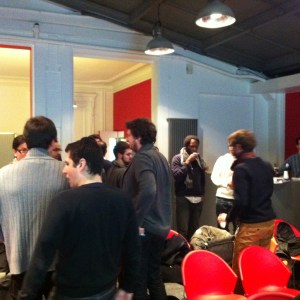
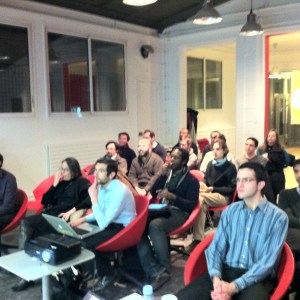
Thursday we were invited by Neo4j France to participate in their monthly meetup. Thank you Cédric for that opportunity. It was a lot of fun.


The meetup was dedicated to the visualization of graphs. Neo4j offers a solution to store and access vast amount of data in graph form. To access and explore this data, it is sometimes easier to visualize it. There are multiple solutions to do that.
Sébastien Heymann presented Gephi, an open-source project he co-founded. Gephi is an interactive visualization and exploration platform for all kinds of networks and complex systems, dynamic and hierarchical graphs. It runs on Windows, Linux and Mac OS X. It is free and with over 100k downloads for the latest version, Gephi is becoming a standard in network visualization. If you haven’t tried it yet, you definitely should.
The good news for Neo4j users is that they can use Gephi with their data. It’s as simple as downloading a plugin. With that plugin you can load your Neo4j database in Gephi and start exploring it.
What’s even better is that you can use that plugin to export data to a Neo4j format. Gephi is compatible with a lot of formats and comes with tools to sort and clean you data. This means that you can get you data inside Gephi, use it for analysis and export your work to Neo4j. If you want to learn more about it, you can watch that tutorial.
Why would you want to export your data to Neo4j? Because then you can search it with Linkurious! Jean Villedieu presented some of the advantages of that approach. First of all, Linkurious is really simple. We want to make the exploration of graph data a seamless experience. This means that to get a graph of what you are interested in, you just have to type in a search bar. You get access to one or more nodes. You can choose to see what they are linked to. This give you a first graph : it is small and focused on what you searched in the first place. This means that it is easier for you to understand it.
From there, you can start exploring. Just choose the nodes you are interested in and click to expand your graph with the nodes they are linked to.
At any point in time, you can remove nodes, see proprieties and customize your graph.
You can access the Linkurious presentation slides here. Be warned, it’s in French 🙂
We had a lot of fun presenting a live demo of Linkurious and interacting with the great people that were attending. It was really interesting to get feedback on our work and a glimpse at the business needs of graph visualization. We will be working on making Linkurious better and we are looking forward to other opportunities to meet with potential users.
A spotlight on graph technology directly in your inbox.

