We have see recently how to use a Neo4j database to run a recommendation engine for an online dating site (or for any recommendation problem). Today, we are going to see a different approach to that same problem based on collaborative filtering.
Collaborative filtering is a technique used by recommendation engines. According to Wikipedia, collaborative filtering is the process of filtering for information or patterns using techniques involving collaboration among multiple agents, viewpoints, data sources, etc.
For example, when you are visiting Amazon you see product suggestions. These suggestions are based on your history and the history of other users. The other users serve as “sensors” who help Amazon identify products you might like. Let’s use a concrete example from online dating. In this context, what could collaborative filtering look like?
As a user after expressing your interest for a few people you’d like to date, a collaborative filtering system could start suggesting you potential matches. You taste will start to match the taste of users A, B and C. The recommendation system will use it to provide you with potential dates. The suggested dates will be in priority the people that A, B and C have liked and that you haven’t seen yet.
This works as if A, B and C were browsing the site to find potential dates you’d like. Their “work” spare you sorting through thousand of irrelevant people. What makes this approach so powerful is that it gives a concrete, personal reality to the expression “the wisdom of crowds”. As an individual you can benefit from recommendation that are based on people you do not know and their preferences. Collaborative filtering is a way to provide concrete insights based with large data sets.
We are going to see a quick example of how to setup a collaborative filtering approach for a dating site. For this we are going to use the Neo4j graph database.
Let’s start by thinking about the data the site has. Let’s say the site works as Tinder. As a user you see the profile of potential mates and you can like them or not. Why could these actions be represented as a graph? When user A likes the profile of user B, we can represent this as an edge between A and B. Quickly as we had more users, we will build a large graph.
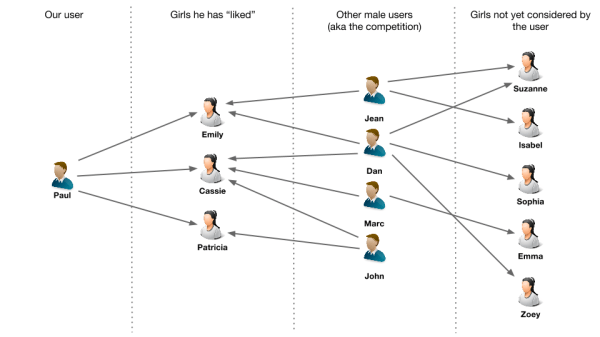
Let’s take an example. Paul is a new user of our online dating site. After setting up his profile he starts looking at girls he might be interested in. Out of 20 random girls he views, he likes the profiles of three girls : Emily, Cassie and Patricia. It turns out that Jean, Dan, Marc and John have also liked at least one of these girls. They seem to share the Paul’s taste. Chances are that Paul would like the other girls his competitors have liked. That’s what we are going to use to make Paul recommendations.

In order to do that, I have created a small data set and loaded in the Neo4j graph database. You can download it here. This will allows us to run our recommendation algorithm.
START Paul = node(1)
MATCH Paul-[IS_INTERESTED_BY]->she<-[:IS_INTERESTED_BY]-slm-[:IS_INTERESTED_BY]->recommendations
WHERE not(Paul = slm) and not (Paul–recommendations)
RETURN count(*) AS recommendationsWeight, recommendations.name AS name
ORDER BY recommendationsWeight DESC, name DESC;
What is going on here? Here is a quick breakdown of the query :
- START Paul = node(1) <– we select the user we want to give recommendations to (Paul here)
- MATCH Paul-->she<--slm-->recommendations <– we are looking for a certain pattern : the girls that are liked by people who have liked the girls our user likes
- WHERE not(Paul = slm) and not (Paul–recommendations) <– we filter out the results to return matches the user has not already met
- RETURN count(*) AS recommendationsWeight, recommendations.name AS name <– we are keeping track of the number of paths leading to each match
- ORDER BY recommendationsWeight DESC, name DESC; <– we return the result ranked according to the number of paths
For those who are curious about the query and want to see a few optimizations, I suggest to read Djamel Zouaoui’s presentation on that subject. His work at Meetic, the leading French online dating website, inspired me to do this post.
Of course, our current algorithm could be improved on but it is a great place to start : it will provide fast personal recommendations to the users of our online dating website. With the same logic, we could be using transaction history to make product recommendations for a retail outlet or an online merchant. All of this thanks to Neo4j and the power of graph technologies!
So, are you ready to use a graph database like Neo4j to build your next recommendation engine? Here is why graph visualization can help you achieve better results quickly :
- visualizing the data will help you understand it : before writing code , it is good to see what is going on with the data ;
- visualization will help you improve your results : as you develop an algorithm, it is important to see the results it delivers to evaluate it ;

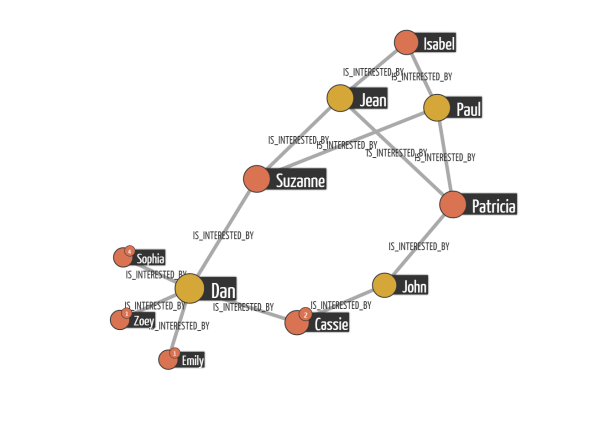
In the case of online dating, graph visualization would help us identify outliers in the data. Online dating websites always have people who aggressively message everyone. A look at the data with a graph visualization solution like Linkurious would help identify that kind of profile.
Visually the average user would be linked to a few dozens of persons whereas someone trying to game the system would have hundreds of links. Based on that observation, we could tweak our algorithm in order to correct the effect of outliers (they are a poor indication in terms of recommendation).
If you want to build a recommendation engine that leverages the connection within your data, you should give graph technologies a try!
A spotlight on graph technology directly in your inbox.