The influence of lobbies on policy making is surrounded with controversy. In order to shed a light on this sometimes obscure activity, the European Union has setup a Transparency Register. We are going to explore the relationships it contains to understand what the lobbies work on and for which companies they work for.
The European Transparency Register is a voluntary lobbyist register. Lobbies, law firms, NGOs, and think tanks who need to easy access to the parliament are encouraged to add their names to the Transparency Registry. The data quality is heterogeneous and some actors are probably missing due to the voluntary nature of the Registry. The Registry data is available in an Excel format here.
We are going to use the Neo4j graph database to turn this Excel data into a graph of nodes and edges. Here is a script to use the LOAD CSV functionality of Neo4j to import the Transparency Register.
The script above turns the spreadsheet into a graph of lobbies, interest fields, countries and companies. A lobby is connected to the companies which are its customers, to a country it is located in and the interest fields it declares.
Now that the data is ready, we can use network visualization to ask and answer questions.
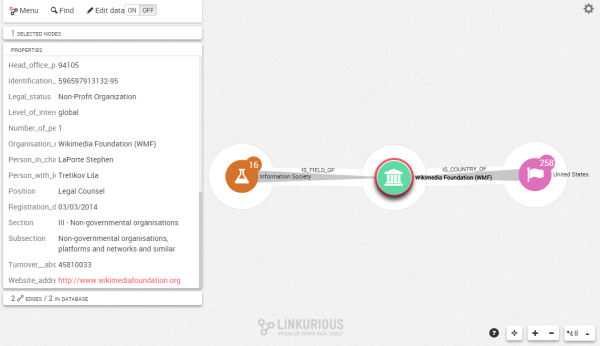
Let’s start with a concrete example. We are going to search the Wikimedia Foundation and explore its relationships.

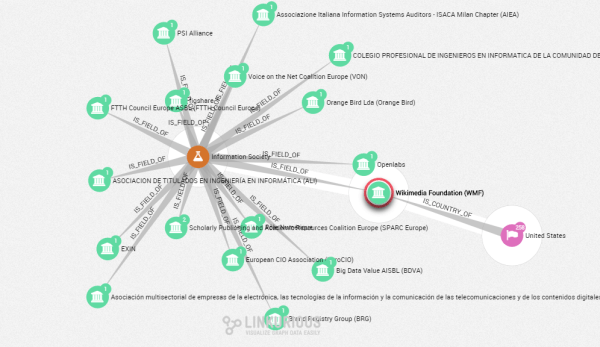
We can see that it’s located in United States and it is interested in the “Information Society” field. That field is connected to 16 other lobbies.

The Wikimedia Foundation shares common interests with organizations like PSI Alliance, Pôle Numérique or the Brand Registry Group. With Linkurious, we can use graph visualization to ask questions about the connections in our data. The result can then be visually interpreted. It makes extracting insights from graph data faster and easier.
For advanced analytics, we can combine the simplicity of graph visualization with the power of a query language. Let’s find for example the lobbies with the highest number of customers. In order to do that, we will use Cypher, the Neo4j query language. It is available through the interface of Neo4j or directly within Linkurious.
Here is how to use Cypher to identify the 5 lobbies with the highest number of customers:
//———————–
//Most successful lobbies
//———————–
MATCH (a:Client)-[r:IS_CLIENT_OF]->(b:Lobby)
RETURN b, count(r) as customers
ORDER BY customers DESC
LIMIT 5
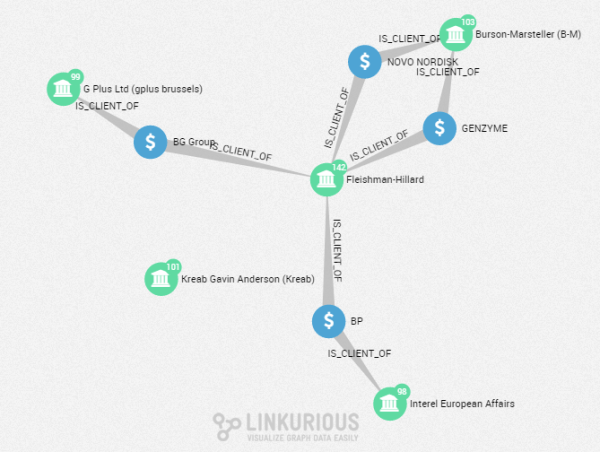
With Linkurious, we can type this query and quickly display the 5 lobbies with the most clients.

Interestingly, we can see that these 5 lobbies share some of the same clients. Flesihman-Hilard and Burson-Marsteller for example are both working with Novo Nordisk and Genzyme.
Graph visualization allows us to quickly identify uncommon patterns within in a network.
The companies in our dataset have no direct relationships with each other but they are connected through the lobbies they hire. We can use this information to identify companies which share several of the same lobbies. They may be (implicitly or not) working on influencing the same policies.
Here is how to do that:
//———————–
//Clients with the best affinity
//———————–
MATCH (a:Client)-[:IS_CLIENT_OF]->(b:Lobby)<-[:IS_CLIENT_OF]-(c:Client)
WHERE a<>c
RETURN a,c, count(Distinct b) as affinity_score
ORDER BY affinity_score DESC
LIMIT 5
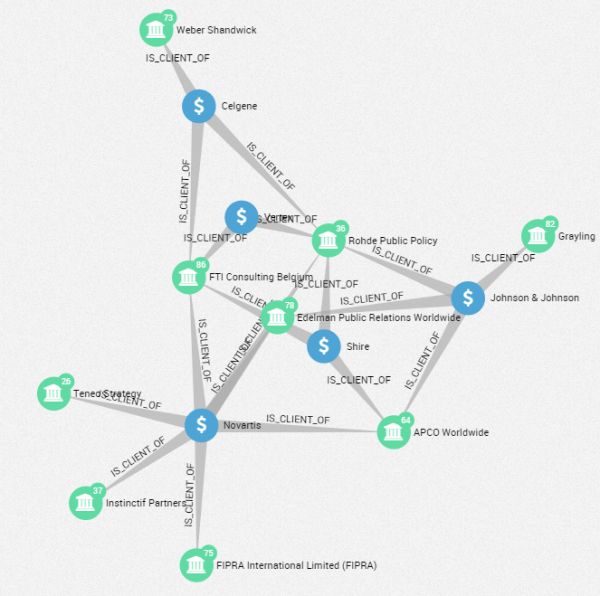
Here are the companies with the highest number of common lobbies:

Interestingly, Novartis, Vertex, Shire, John & Johnson or Celgene are all pharmaceutical companies. It seems they are employing a small group of lobbies in which Edelman Public Relations Worldwide, Rohde Public Policy, FTI Consulting and APCO Wolrdwide are featured prominently.
Unfortunately, the data in the Registry is not standardized. Even though lobbies have to list their customers, the experts groups they attend or the organization they are member of, in practice this information is hard to use. There is still a lot to do to really enforce transparency. Open Interests for example is combing different data sources to map the relationships between the actors involved in lobbying, expert groups, public expenditure and procurement.
We have seen that graph visualization can help us identify the relationships between the lobbies and their customers.
A spotlight on graph technology directly in your inbox.