Anti-money laundering (AML) and graph analytics are a match made in heaven. A lot of anti-money laundering use cases require connecting the dots between people, companies, and transactions. That’s exactly what graph analytics is great at: making sense of complex, connected data at scale. In this article, we explore practical AML use cases where graph technology can enhance compliance efforts, accelerate investigations, and strengthen financial crime detection.
Illicit financial flows aren’t small: according to the UN’s FACTI Panel, approximately 2.7 percent of global GDP, around $1.6 trillion per year, is laundered worldwide. Those numbers really show you why graph analytics for AML isn't just helpful, it’s essential for spotting intricate money laundering networks buried in connected data.
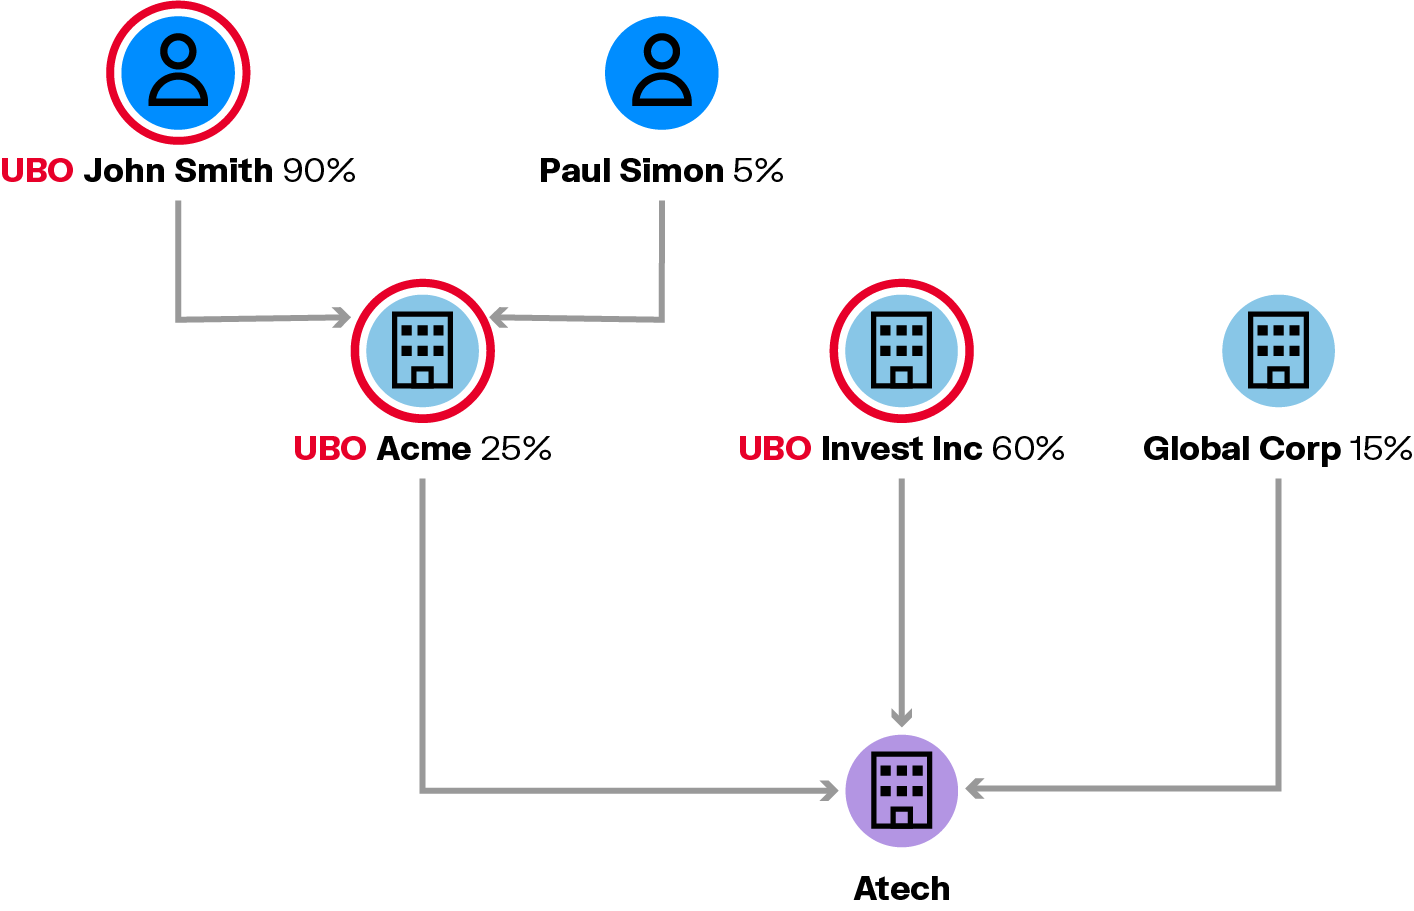
Financial institutions need to detect the real individuals behind corporate structures, the ultimate beneficial owners (UBOs). These people often sit behind multiple entities and ownership layers, which makes tracing control or influence tricky.
If a company is owned by a single shareholder, things are easy. It gets tricky when the number of ownership layers increases. Manually looking at the ownership structure of each company to identify its UBOs and repeating the process until there are no new UBOs is a time consuming and error-prone process.
With graph analytics, you can write one query and get the full picture. Even better, you can visualize the whole structure and spot odd patterns or people right away. Compliance analysts can look into the overall ownership graph to identify where a problematic UBO sits, for example.
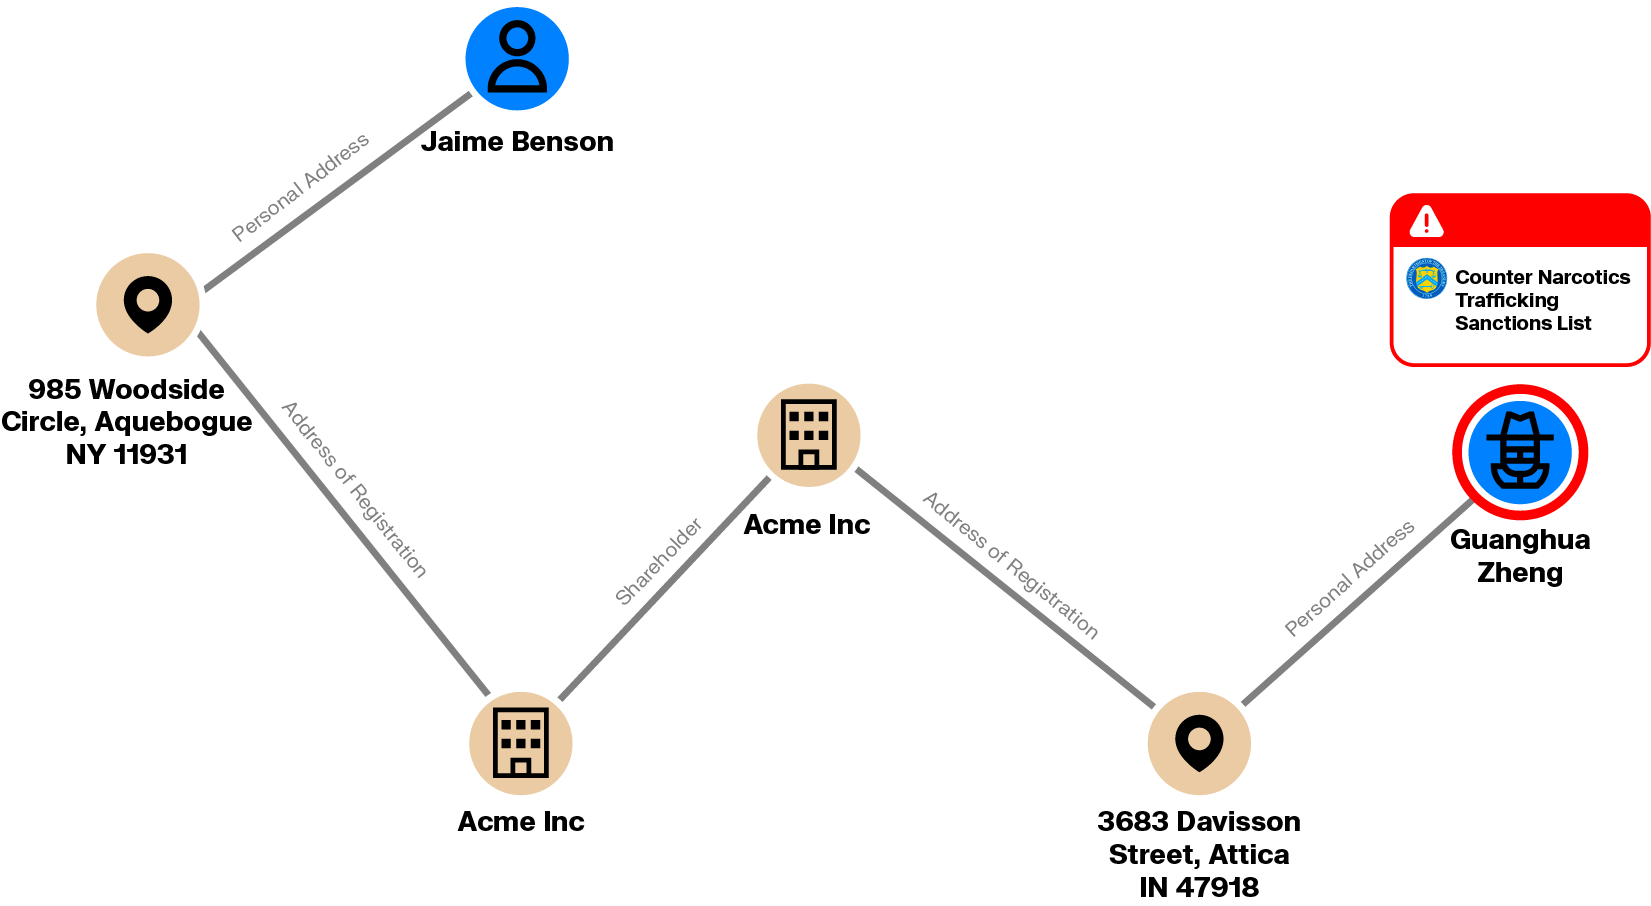
Banks and other financial institutions are tasked with screening their clients to identify their potential ties with politically exposed persons (PEPs) or individuals and organizations that are in sanctions lists (such as the lists published by the Office of Foreign Assets Control). These persons represent high money laundering risks. But risky people don’t exactly advertise their connections.
The relationships between a client and risky entities can be as simple as a shared address. In this case, detecting such a situation is easy. But what if the risky entity wants to engage in money laundering? Chances are that a lot of effort will go into hiding the relationships to escape enhanced due diligence. Graph technology for AML enables institutions to identify hidden relationships across clients, companies, and metadata, like shared addresses, emails, IPs, or co-ownership. It flags not just direct connections, but layered associations that may point to hidden risk.
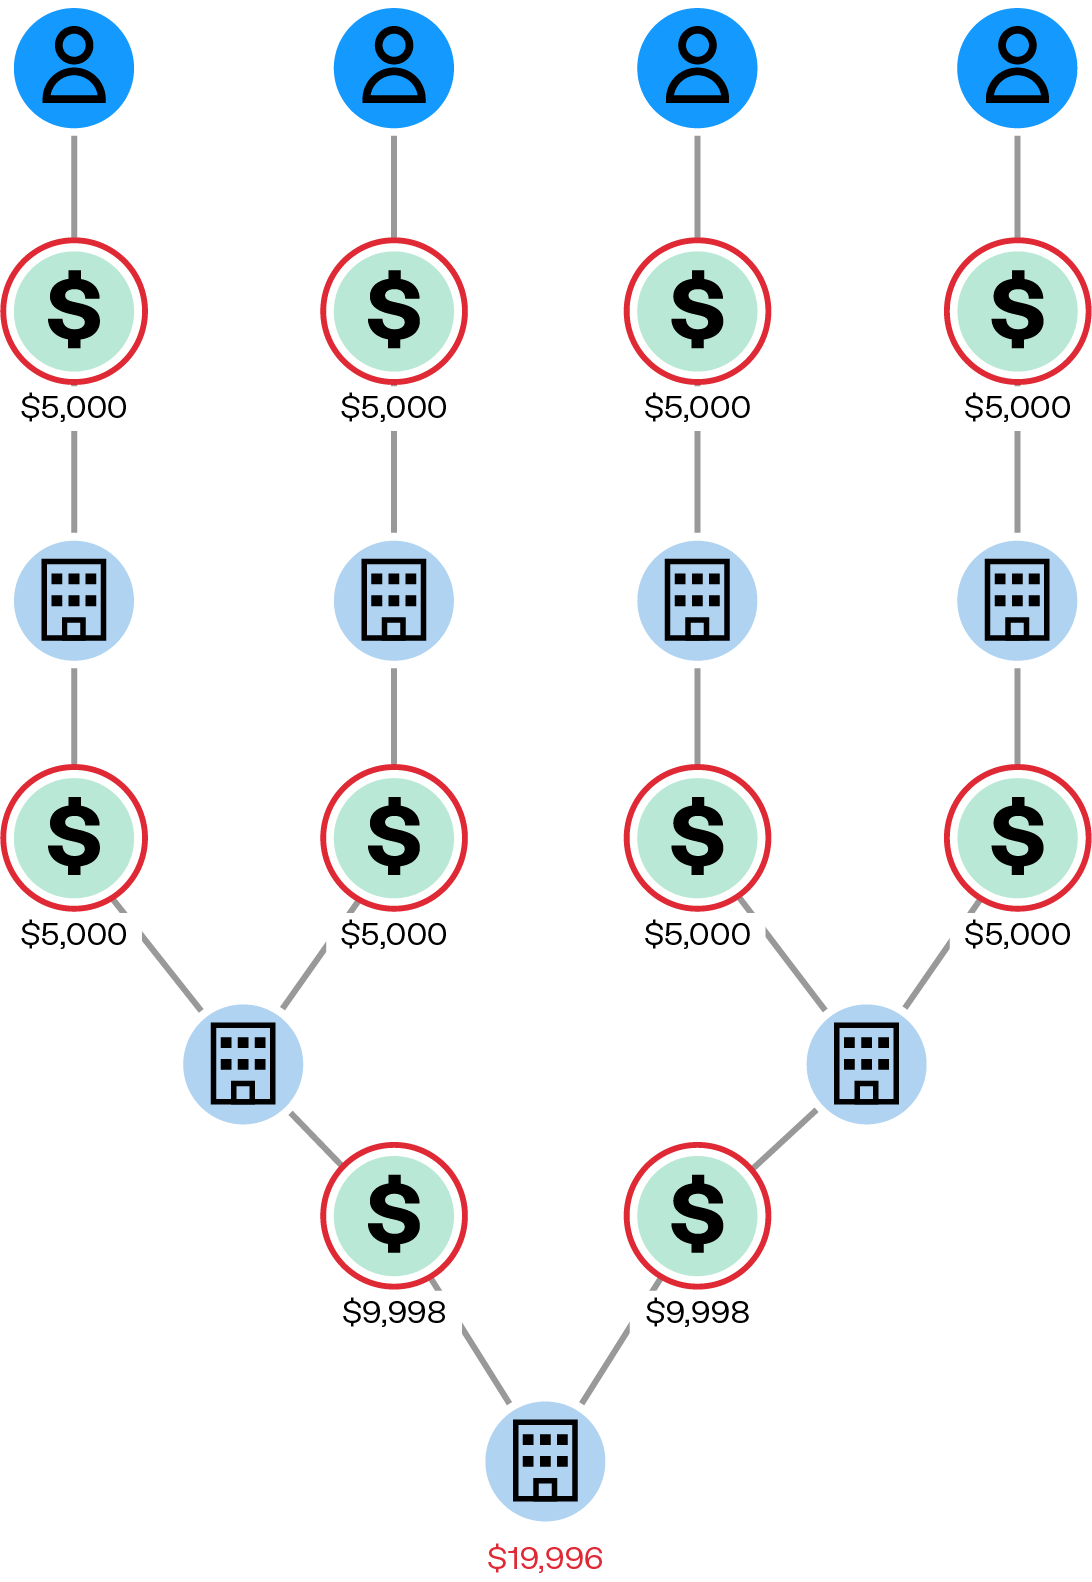
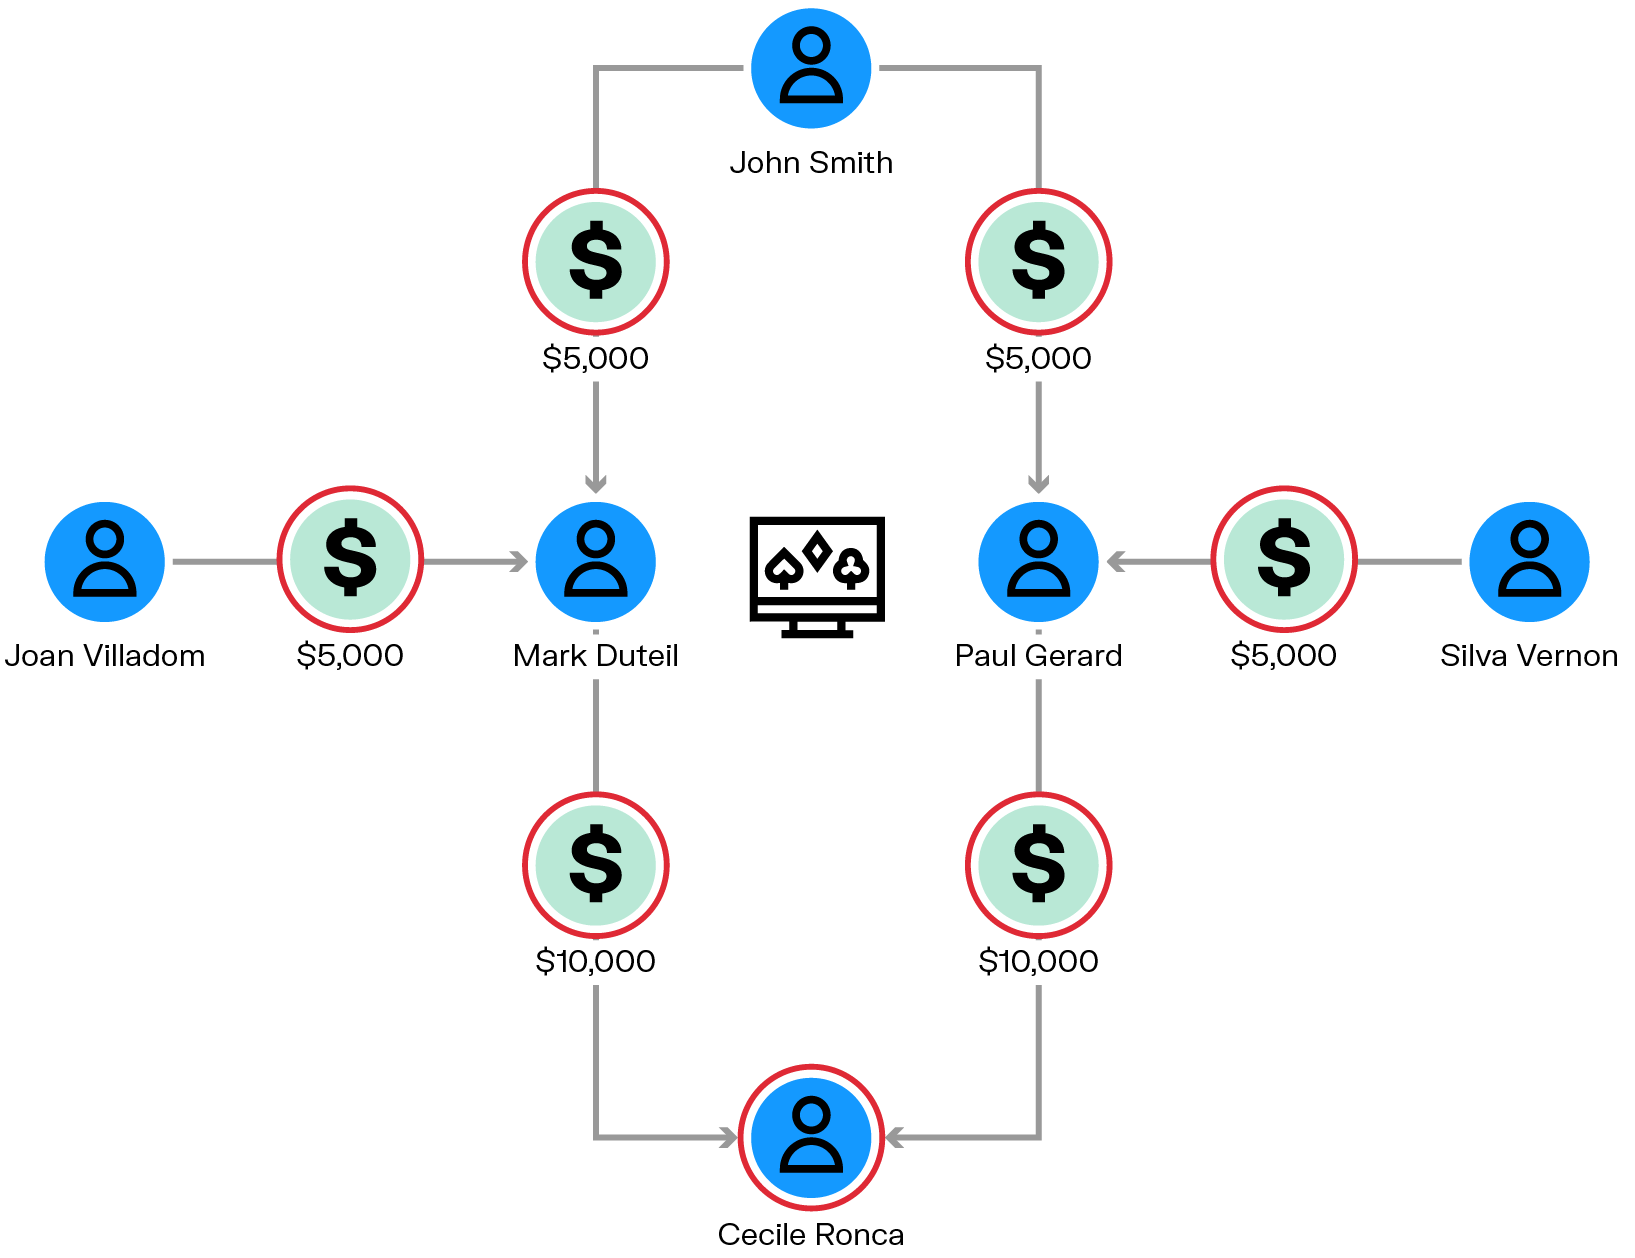
What if you’re a drug dealer with a lot of cash that you would like to deposit in a bank account that you control? Going to a bank with a sports bag and depositing the money is not a viable option. The bank will be obligated to file a Suspicious Activity Report (SAR) if the transaction is above $10,000.
One approach consists in breaking down your transaction in order to bypass your bank’s control systems. For example, you could ask 3 of your neighbors to each deposit $4,999 and then wire you the money. Adding more people and more layers in the scheme will make it possible to launder more money and further conceal the situation. Detecting such patterns is more complex than simply checking whether a series of transactions on an account match a certain threshold.
Structuring detection is a perfect example of why you need AML graph analytics. Graphs can surface patterns that would be invisible in tabular views, such as coordinated transactions across loosely linked accounts.
Round-tripping is the process of moving funds through entities, shell companies, financial instruments, or jurisdictions with lower regulatory oversight, only to return them to their original source. This creates the false appearance that the money comes from a legitimate origin, effectively completing the cycle. The more entities involved in the round trip, the easier it is to miss a link in the chain. When that happens, instead of a round trip, a compliance analyst would see two distinct money flows and fail to identify the money laundering scheme.
Graph analytics are ideal for tracking the circular movement of funds, even across billions of nodes. They reveal hidden loops and financial trails that traditional systems miss.
Online gambling offers an opportunity to transfer money discreetly. Sit at a poker table where your accomplice is also present, you can then bet money on hands and lose on purpose. The end result is that the money has been transferred to your accomplice. How can an online gambling operation identify the groups within its community that are engaging in money laundering?
Graph platforms allow you to turn the playing history into visualizations of flows of money across players. It then becomes possible to look within this graph of transactions for suspicious patterns such as a player who is always on the receiving end of money flows from players who never play with anyone else.
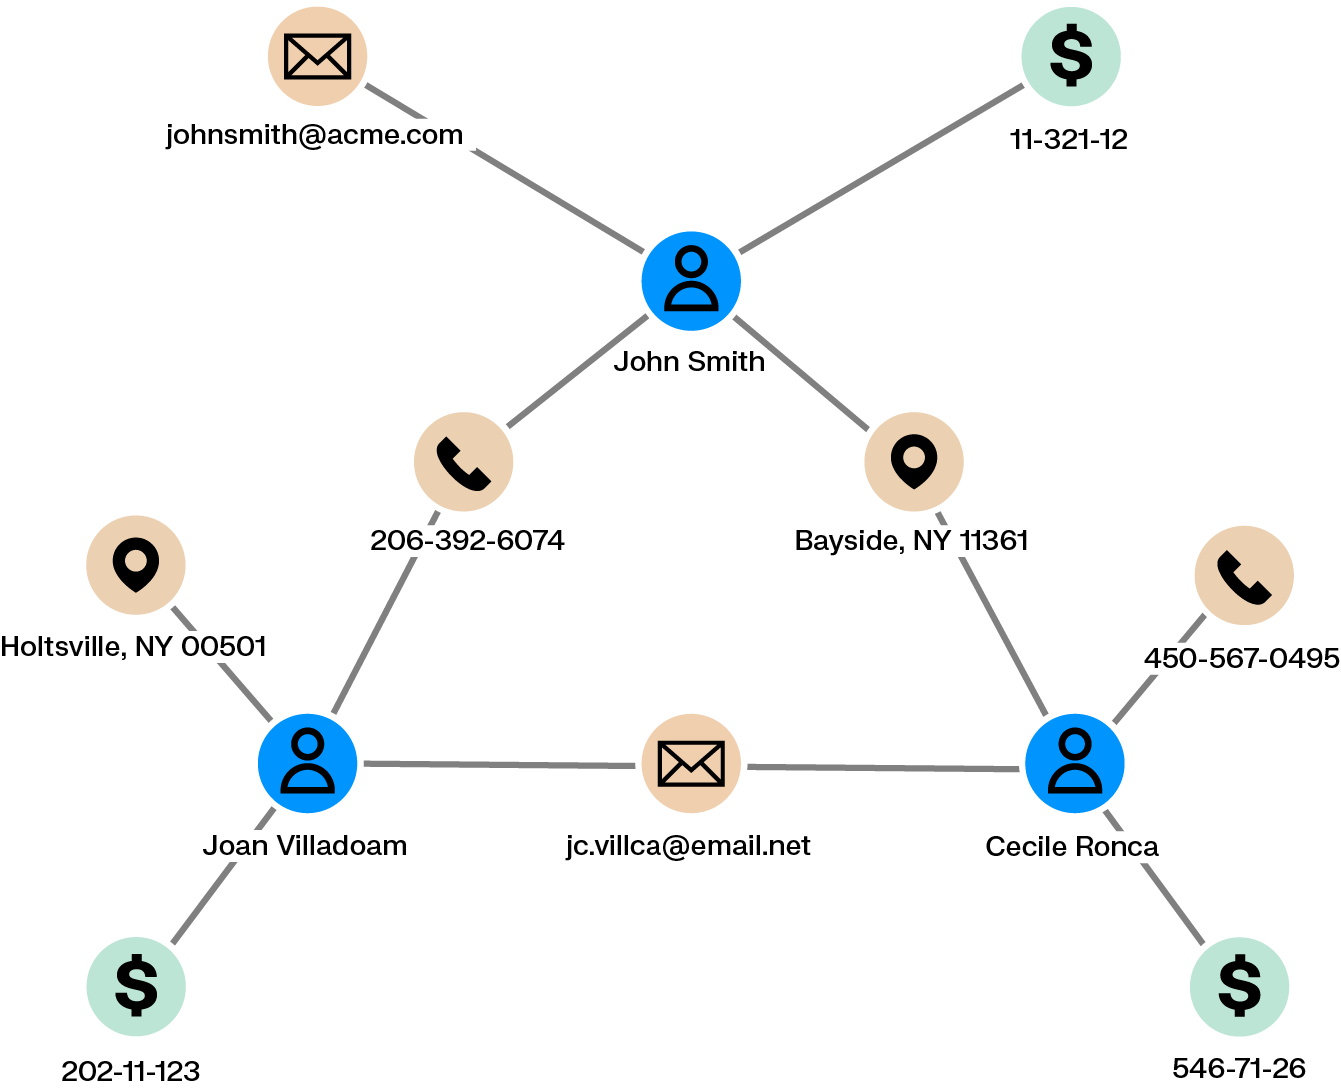
Sometimes a tip or a detection system flags a client or a transaction as suspicious. The key question then becomes whether this is an isolated incident or part of a broader pattern. The client might be connected to a broader criminal network, or the transaction could be just one element of a more complex scheme.
When context is limited, investigators need to pursue every potential lead, which requires examining what the client or transaction is connected to. However, this process can quickly become time-consuming, especially when the data is scattered across multiple tabs. For instance, identifying who a person is connected to directly and indirectly through financial activity often begins with a single tab showing their transactions and recipients. From there, the same type of tab must be opened for each recipient in order to continue tracing the links.
Anti-money laundering graph analysis facilitates the dynamic exploration of relationships within a large dataset. It’s possible to explore and visualize who and what a client is connected to across information as diverse as an address, a phone number, an email, transactions, etc. That shortens investigation time and improves outcomes.
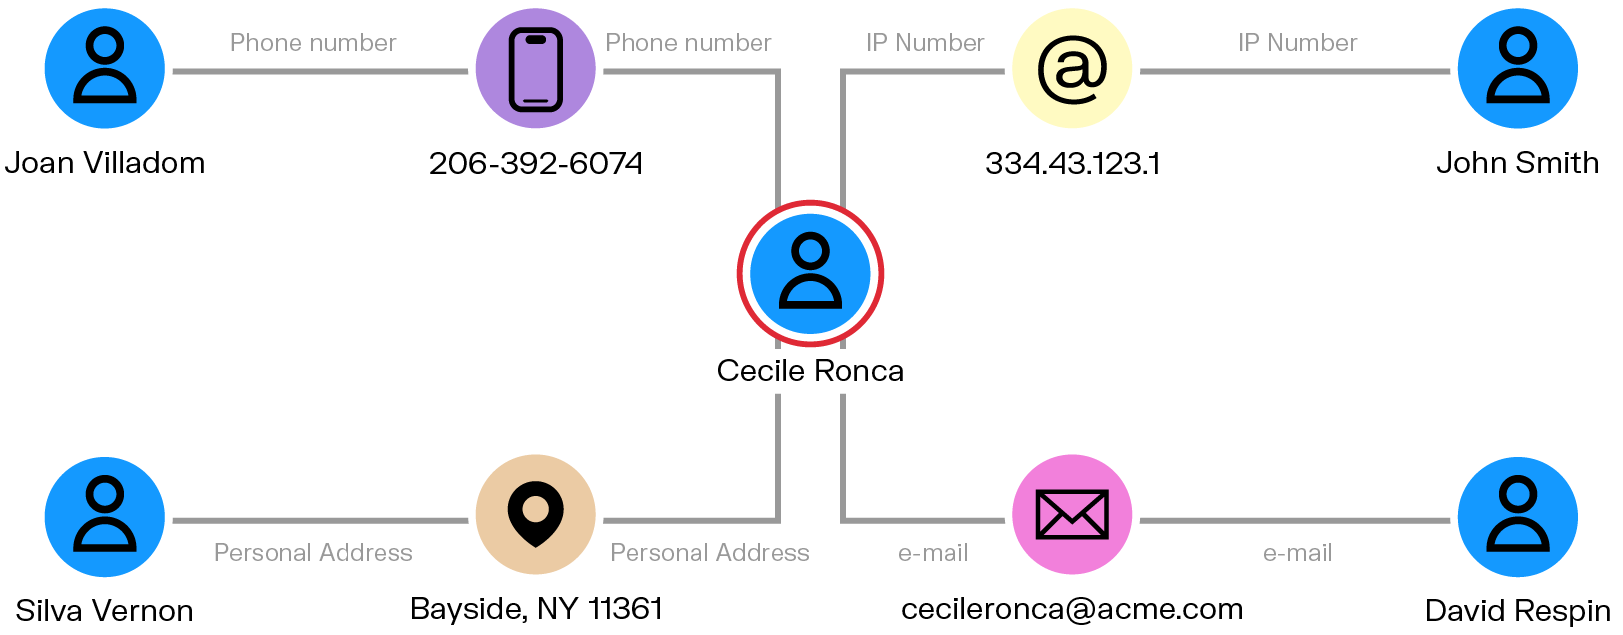
Criminals that want to defraud a bank or launder money typically try to cover their tracks. One approach is to create fake identities to commit their wrongdoings. A synthetic identity is a fake identity that mixes real or fake information (such as a real social security number or a fake name) that does not belong to a single real person. Detecting synthetic identities can help stop criminals before they commit financial crime.
Graph visualization can help detect rings of clients interconnected across personally identifiable information such as an address, a phone number, a date of birth, an IP address, etc.
Graph technology enables analysts and investigators to go beyond isolated data points and understand the relationships between them. It brings data from different sources together, breaking down silos and creating a unified view of risk.
In AML investigations, understanding connections is essential. It helps reveal how money moves, who is involved, and whether suspicious activity is part of a broader pattern. Visualizing these connections makes it easier to detect money laundering schemes that involve complex, organized networks.
A graph-based investigation platform like Linkurious makes these relationships easier to see and explore. It combines AML data visualization with powerful graph analytics, helping teams move from detection to resolution faster. With intuitive visual tools, complex data becomes easier to interpret.
In the face of increasingly sophisticated money laundering techniques and evolving financial crime threats, graph analytics gives financial institutions a strategic advantage.
Want to learn more? Download our free ebook to discover how a graph solution for anti-money laundering can enhance your investigations.

A spotlight on graph technology directly in your inbox.