Brute force is a basic hacking method and yet it is effective and hard to spot. What if graphs could help identify brute force attacks?
In a brute force attack, a hacker will access a system by trying a list of passwords until he finds one that works. It would be the equivalent of looking in an infinite key chain for a key that fits a door. Not the most elegant approach but it has to work (eventually).
Why does this method works? People prefer simple passwords. Names, common words, movie titles, etc. These are not random combination of words and thus can be guessed. A possibility for that is to use a dictionary. Dictionaries of passwords are readily available on the internet and contain the most commonly used passwords. Even if you are not using a “common password”, chances are that you are using a limited subset of characters (the arabic alphabet). Assuming, no capitalization, there are 11 881 376 possible 5-letter words.
A brute force attack consists in trying these combination, starting with the most likely. It takes times but if it is not detected, it will succeed.
We recently discussed how to use a graph database to spot suspicious login attempts via geolocalization. In a recent article, Sachin FromDev explained that graphs can also be used to spot brute force attacks. In order to accomplish that, he suggests using the client IP addresses, the login attempts and their timestamps. These different entities can be represented in a graph.
An IP is used to make a (successful or wrong) login attempt on a user account.

We see two kind of nodes : the IP addresses and the users. The relationship between them can be a successful login attempt (on the left) or a wrong login attempt. These relationships have a timestamp. Sachin FromDev also suggested storing on the relationship whether the password used in the login attempt is weak or not. With the data modeled as a graph, we can start thinking about the patterns we want to detect.
A first approach would be to identify an unusual number of login attempts from a given IP. In order to spot this, we are going to use Cypher, a query language that works with the Neo4j graph database. I have prepared a small dataset based on the work of Sachin : you can download it here and load it in Neo4j to follow this tutorial.
MATCH (n:IP_address)-[r:WrongPasswordAttempt]->(b:User)
WHERE toInt(r.timestamp) > (1411992617-18000000)
WITH count(r) as count, n
WHERE count > 4
RETURN n as SuspiciousIP, count as NumberOfAttempts
This query should return us the IP adresses used to attempts more than five unsuccessful logins within the last 5 minutes. In our dataset we have one result : 68.180.194.242.
Based on this we could automatically ban the suspicious IP identified through our query. Of course, this is only a starting point and would be sufficient to deter sophisticated hackers. The attackers could for example use multiple IP addresses to make our task harder. In that case, our first query would be of no use. The data we have could still enable us to spot an attack though :
MATCH (b:User)<-[r:WrongPasswordAttempt]-(n:IP_address)
WHERE toInt(r.timestamp) > (1411992617-18000000)
WITH count(DISTINCT n) as count, b
WHERE count > 2
RETURN b as SuspiciousAccount, count as NumberOfAttempts
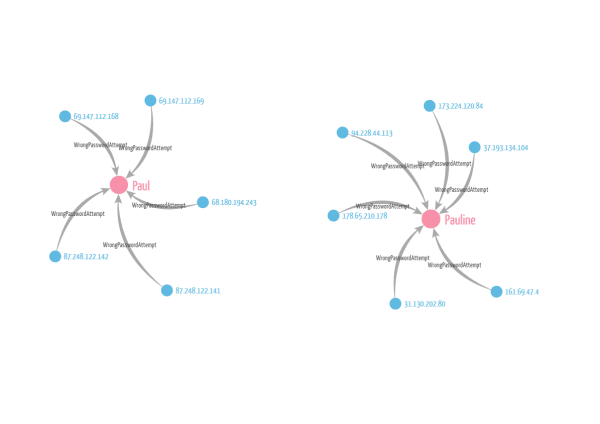
This query returns all the accounts with 3 failed login attempts linked to more than 1 IP address. In our dataset we have 2 results : Pauline and Paul.
As we collect suspicious IPs, we might want to control what accounts they have successfully accessed. For example we can look up the successful logins of “68.180.194.242” :
MATCH (n:IP_address)-[r:SuccessfulPasswordAttemp]->(b:User)
WHERE n.name = ‘68.180.194.242’
RETURN b as CompromisedAccounts
Looks like the accounts of two other users, Amanda and Anna, have been accessed by the IP address 68.180.194.242. We should warn the users of these accounts as they might have been hijacked.
Security logs can be hard to analyse. We have seen that by putting the data in a graph we can start looking for suspicious patterns easily. The security professionals can then focus on analyzing the cases that match the patterns.

Visualization can make this job faster. Looking at the data helps analysts decide whether they face a false alert or a real brute force attack. They can then react accordingly by blocking a range of IP address for example…or simply discard the alert.
A spotlight on graph technology directly in your inbox.


