A US defense contractor is using a graph-based approach to understand how Ebola spreads.
Scientists and medical professionals are in the forefront fighting Ebola. Part of their job is to investigate data to understand the virus and how it spreads. They can rely on new technologies for that. For example, an algorithm was able to predict the Ebola outbreak before it was announced. Now a Florida-based company called Modus Operandi claims to be able to help track how the virus spreads.
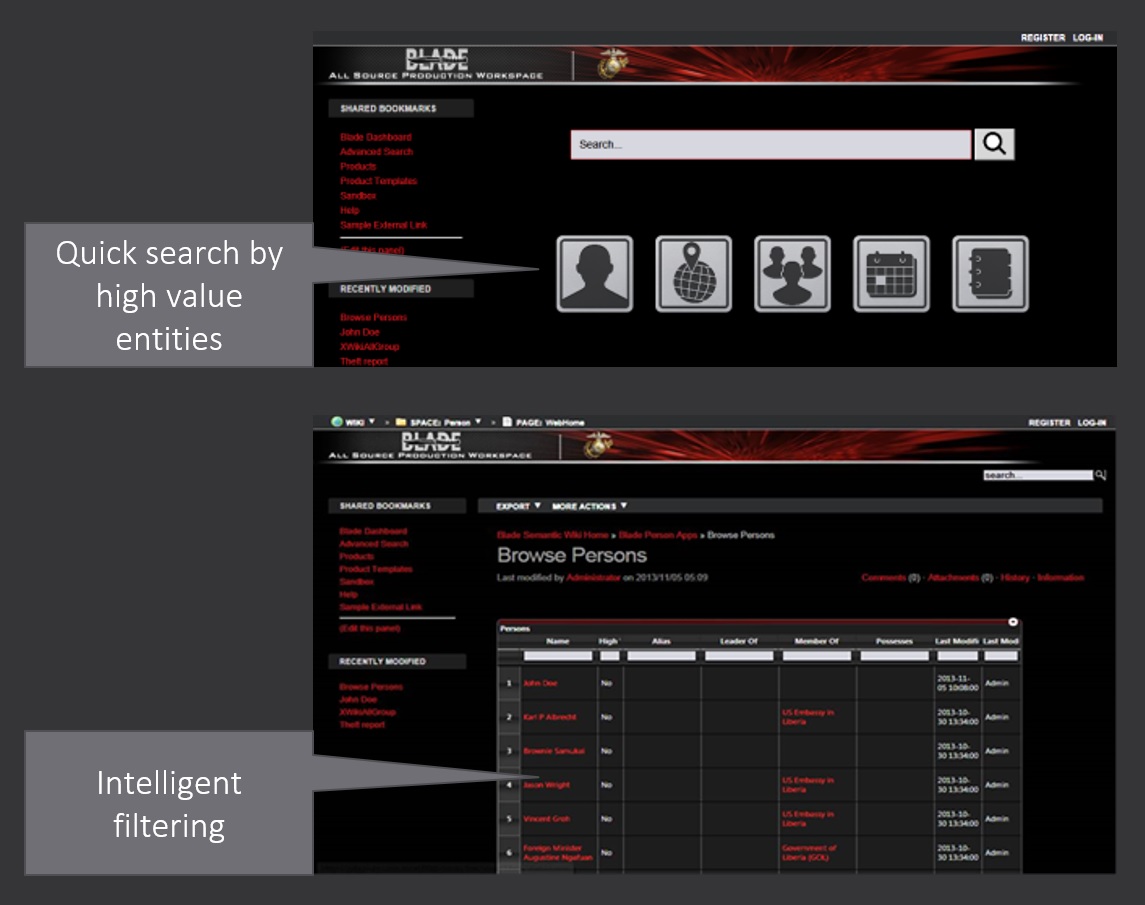
Modus Operandi specializes in big data analytics and semantic analysis. The company has customers like the U.S. Marine Corps or the Department of Defense. Among the solution it develops is a Facebook for terrorists, a software that helps track the social networks of terrorists.

Why would that kind of technology be applied to Ebola? Diseases, like ideas, spread when people get in contact. You can actually learn the basics of virology through network visualization. If you are reading this blog post, you probably already know that graphs are the best way to represent and study the connections between different entities. That is key to understand the diffusion of a virus.
To fight a virus like Ebola, it is important to understand how it spreads. The goal is to contain it as much as possible. A graph model can be used to represent the different persons infected by the virus and the places, persons, activities and everything else that connect them. Instead of looking for the hidden network that connects terrorist, the scientists and doctors fighting the virus need to understand how it moves to stop it.
That task can be tricky. According to Noah Robischon of FastC@mpany, “In the case of a disease like Ebola, data used to track the spread of the disease can come from any number of sources, starting with tissue samples and medical reports taken in the field. Factor in information from medical labs, NGOs, public research, and private institutions and you have a pretty hefty mess of data that comes in any number of different formats, if it’s even structured at all”. Working with massive and unstructured data is always a challenge. This is exactly the problem that graph databases solve.
In the past years, health research has become increasingly data-driven. There is now a whole field of studies dedicated to the application of computer sciences to health research. Bioinformatics as it known offers the potential of turning medical data into new cures and improved treatments.
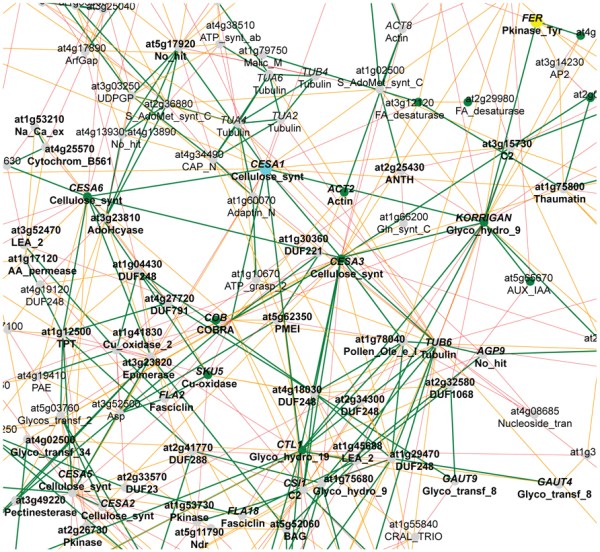
In this highly competitive field a few startups have a secret weapon. They are using graph technologies to uncover hidden insights in massive datasets. It is not just the virus that can be studied with graphs. Genes for example can be represented as a graph. Biologists study the similarity between genes to identify groups of genes that are ‘functionally’ related or co-regulated. Similar genes can be represented as nodes linked by a relationship. This approach helps build a co-expression graph.

To understand the complex structure of a co-expression graph and retrieve information, visualization is key.
Among the graph-oriented startups are :
- Doximity : a social network with over 300 000 physicians ;
- Bio4j : a framework for protein related information querying and management built by Era7 and Oh no sequences! ;
- GoodStart Genetics : a company doing genetic carrier screening for inherited diseases ;
- Zephyr Health : a company building a data platform to process big data ;
Graphs are great to understand the connections within large datasets. It can be used to track how a virus like Ebola spreads but also to conduct genetic research. Like other fields, the medical world is turning to graph technologies to unlock the value of its data.
A spotlight on graph technology directly in your inbox.

