How to turn data into a graph? As part of our series on Crunchbase, we are going to see how to transform a spreadsheet into a Neo4j graph.
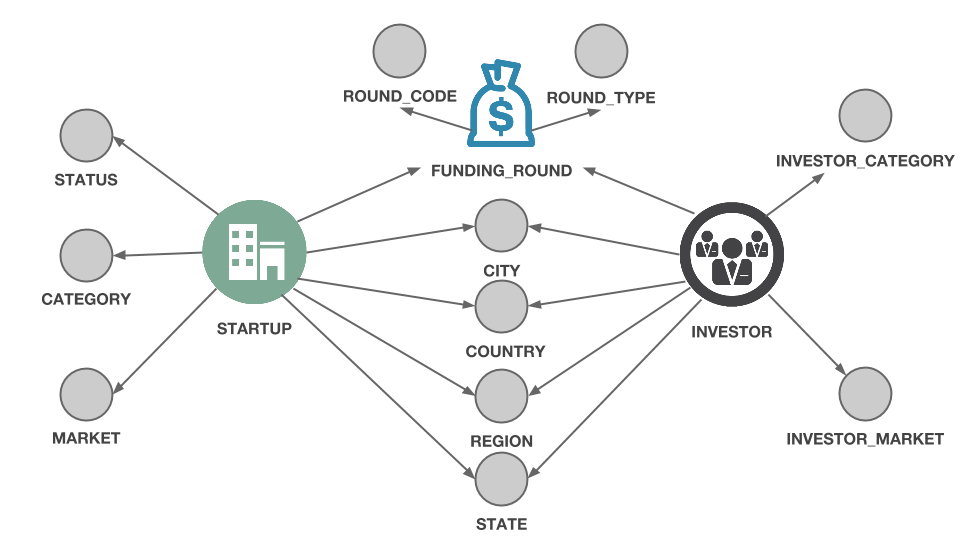
Last time we elaborated a model that described how we could populate a graph with the data found in the monthly Crunchbase dataset. That model is going to be our map : it tells what our final dataset will look like.

Right now though, our data is stored in a spreadsheet.
The first step of our journey will be to export the data from the spreadsheet to CSV files. With OpenOffice, we need to select the “Companies” spreadsheet by clicking on the bottom left corner. Then we select “File” and “Save As”. Next we need to choose to the “CSV text” data format. Hit save.
Repeat the same steps for the “Investments” and “Acquistions” sheets.
Now we have three CSV files. I have uploaded them here : Investments, Acquisitions and Companies. We are going to use the built CSV import functionality of Neo4j to turn our files into a graph.
Neo4j is a graph database. It includes a query language called Cypher. We can use Cypher to turn the data stored into our CSV files into nice nodes and edges.
I have prepared a script for that :
Here are a few remarks about this script :
- I’m starting by deleting any nodes and edges that could be already in the database ;
- next, I’m asserting a few constraints to make sure no duplicates will be created in the importation process ;
- then, the actual importation can start with the creation of the nodes form the “Companies” CSV (we need nodes to create edges!) ;
- the “LOAD CSV WITH HEADERS FROM” command means I can use the names of the columns ;
- before starting the creation of the edges, I create an index on the companies to speed their lookups ;
- I’m splitting the creation of edges into different “LOAD” statements : it seems to speed up the process ;
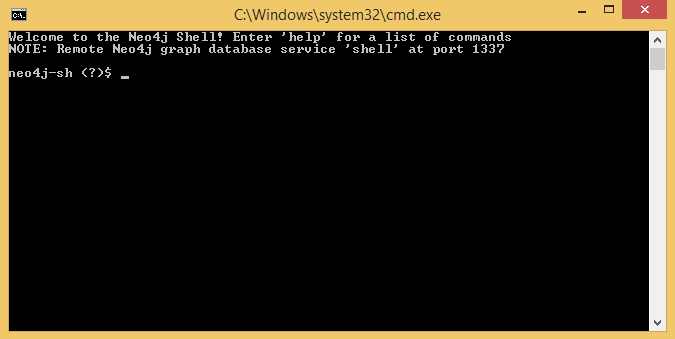
In order to run the script on Windows we are going to use the Neo4j-shell. A (slower) alternative would be to use Neo4j’s browser. In the “/bin” directory of Neo4j, right click on “Neo4jShell” and choose “Run as Administrator”.

Simply copy the text from Github and paste it in the terminal.
Most of our customers start with data stored in spreadsheets or their “enterprise” equivalent : relational databases. They are accustomed to look at data in tables (or pie charts, histograms, etc). That kind of approach can work for many domains. If you are working with connected data and asking questions related to “connections”, relational technologies fail :
Here are some common problems we have heard :
- querying the connections in my data is slow and hard (the “join bomb” problem) ;
- no easy way to explore the connections in my data (who knows who? what this equipment depends on?) ;
- understanding how things are connected is too difficult ;
- my data model does not capture the connections of my business logic ;
Graph technologies are not the solution to all data problems but if you find yourself saying the sentences above, it might be interesting to check out what can be done with graphs!
I was not familiar with the CSV load functionality of Neo4j and found the following resources very helpful :
- the Neo4j official doc on importing csv files ;
- the basics of importing csv files and advanced tips on indexing, data quality and memory by Michael Hunger ;
- interesting points on optimizing the importation speed by Mark Needham ;
I had no prior knowledge of the CSV load functionality of Neo4j. I managed to transform a fairly complex spreadsheet in a graph thanks to the resources above: that means you can do it too! There is also a very supportive Neo4j community : if you’re stuck, you can find answers on Google Group (thank you Mark!) or on Stackoverflow.
Now that we have our data stored in a Neo4j graph database, we can start analyzing it. The next step of our series will be to look into the Crunchbase Graph and identify interesting patterns with Cypher. Stay tuned!
A spotlight on graph technology directly in your inbox.

