A data model organizes a set of data and establishes how different data elements relate to one another. Data models help organizations use their data effectively for decision making and other business needs. A relational model organizes data in terms of tables.
A graph data model, on the other hand, organizes data as a graph, taking into account not only the individual data points, but also the relationships within the dataset.
This article gives a quick overview of graph data modeling: what is, why it’s an essential step to analyzing your data as a graph, and the elements that make up a graph data model. We also look at how you should think about your data as you model it as a graph to make sure the analysts working with your graph can use the data effectively.
Graph data modeling is the process of describing a dataset to be able to use it in a graph database such as Neo4j, Azure Cosmos DB, Amazon Neptune, Memgraph, or others. This process means deciding which elements within your dataset will be defined as nodes, edges, and properties (more on those in a moment). There is no one set way to do this, so graph data modeling involves some important decision making to ensure the graph is useful to its end users.
The process of graph data modeling ultimately allows you to query your data using graph analytics algorithms. You can then use that graph data to answer questions, find key connections, understand patterns within your data, and more. It allows you to see connections that were present in the original data but difficult to track down in a spreadsheet. There are many use cases for data modeled as a graph, ranging from fraud investigation to cybersecurity to supply chain management. You can also use it to build a knowledge graph.
There are three basic elements to a graph data model: nodes, edges, and properties. Below is a quick definition of each of these.
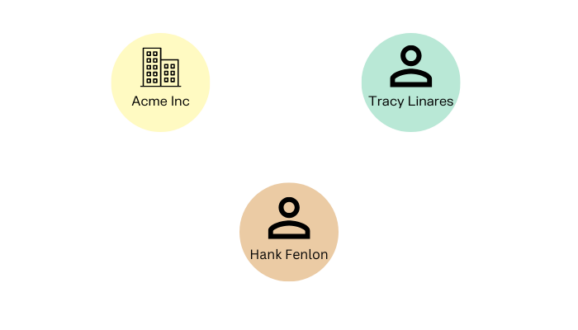
In a graph, nodes represent individual entities. They are one of the fundamental units of a graph. One trick to find the nodes is by looking at the nouns within a domain: people, places, things. In a financial crime use case, these could represent individual persons, financial institutions, companies, or addresses. In a life science context, nodes could be drugs, proteins, etc.
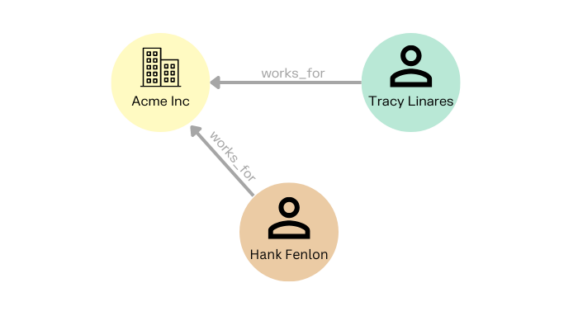
Edges are the relationships between nodes - the data that connect entities. They are the other fundamental unit making up a graph. Edges can be single or directed, which is when the direction of the relationship is important. An example of this would be a person transferring money to someone else, where you would see the money moving in a specific direction.
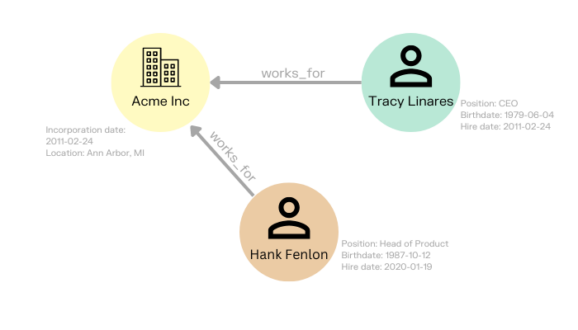
Properties are the characteristics of nodes. The information found in properties doesn’t carry enough weight within the graph to be a node. Examples of properties could be a job title for a person, or an incorporation date for a business.
Now that we’ve covered the basics, this next section looks at the different steps of modeling your data as a graph.
The first crucial step in graph modeling is understanding how your data will be used. Understanding the questions analysts will need to answer using the graph will guide data modeling. You can even list out the questions you have in mind to ensure your graph data model can answer them.
Something that is important for the analysis or investigation should be modeled as a node, whereas less important elements should be properties.
If you’re moving from a relational model to a graph data model, you don’t necessarily need to include every single piece of data in your graph model. If certain pieces of data stored in your relational database are irrelevant to the work that will be done with the graph, you can decide not to include it.
Let’s look at a specific (simplified) example: monitoring for mule account fraud in a banking context. Monitoring for fraud and money laundering activities involves lots of data, and is highly dependent on understanding the connections within the data: how two clients are connected, for example, or how money flows between several different accounts.
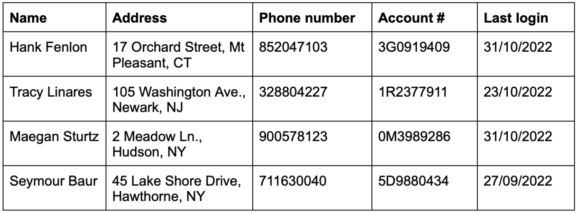
Some of the data you might use in this case would include client information, laid out here in a table:
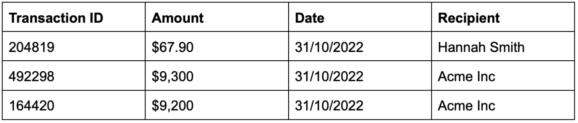
And transaction data:
Understanding the connections between this data is time-consuming when it’s confined to tables, so this is an ideal use case for a graph model.
In a fraud or money laundering use case, analysts will want to understand who is connected to whom and where money is flowing. It would make sense for each bank client and each account number to have its own node. Personal identification information can also be useful for establishing connections between bad actors, so we’d want to model address and phone number as nodes as well. Last login is less relevant for the problem at hand, so we would make that a property. The edges between these nodes would then be modeled according to the nature of the relationship. For example, the edge between an individual and an account would be has_account; or has_address between an individual and her address.
As far as the transactions go, the transaction IDs are unique identifiers and can therefore be defined as nodes. Analysts will also want to be able to quickly understand relationships between senders and recipients, so the recipients will also be modeled as nodes. The amounts and transaction dates, on the other hand, can be modeled as properties.
When all this data is modeled as a graph, it eliminates the need to rely on separate spreadsheets, making it far easier to query the data and locate key insights.
Once your data is modeled as a graph, you can start to visualize it to query and explore your data. Being able to visualize your data as a graph accelerates analysis. Using network visualization comes with many benefits: it’s intuitive and time to insight is much faster, since the human brain processes visual information much faster than textual information. It’s also easier to share insights and key findings with the help of a visual support.
Linkurious is a software company providing technical and non technical users alike with the next generation of detection and investigation solutions powered by graph technology. Simply powerful and powerfully simple, Linkurious Enterprise helps more than 3000 data-driven analysts or investigators globally in Global 2000 companies, governmental agencies, and non-profit organizations to swiftly and accurately find insights otherwise hidden in complex connected data so they can make more informed decisions, faster.