Cyber security experts have a challenging job. They analyse huge datasets to track anomalies, find security holes and patch them. Reacting quickly against an attack is key. We are going to see how graphs can accelerate an attack analysis and help identify potential attack vectors before they are used.
In the past few years organizations like Sony, LinkedIn, NASDAQ or the CIA have been hacked. For these organizations, it has resulted in private information exposure, downtime, tarnished reputations and millions of dollars in lost revenues.
There is no sign that these attacks are going to stop either. Criminals are well other of the value of information. Today for example, there is a black market where Zero-Day exploits, an attack method that exploits a previously unknown security breach, can be sold. The best hackers can sell to the highest bidder their discoveries. The market is booming, stimulated by governments who are looking to arm themselves.
The cyber security teams are under increasing pressure from these new threats. To defend their organizations, they can rely on a wealth of data. Typical monitoring systems can generate in the terabytes of data : can it be used to thwart attacks?
Cyber security teams have a wealth of data on their hand. From IP logs, network logs, communication or server logs, the various tools they use to monitor their systems generate a lot of data. Large enterprises generate an estimated 10 to 100 billion events per day. That sort of volume is a challenge for traditional security information and event management (SIEM) tools. They are designed to analyse logs, network flows and system events for forensics and intrusion detection but are not equipped to handle big data.
Volume is an issue for security experts but it is not necessarily the biggest one. Security data is often both large and unstructured as it comes from heterogeneous, incomplete data sources. Working with unstructured data in tabular oriented tools is never a good idea. It can work but at a price :
- difficulty to integrate new sources ;
- complexity in structuring and querying the data ;
- poor performances when querying the data ;
On the contrary, graph databases like Neo4j, Titan or InfiniteGraph make it easy to store and query unstructured data, even as the volume grows. That is why companies like Cisco are turning to graph technologies to design the next generation of cyber security solutions. With Titan, Cisco ingest 10 terabytes of security data per month.
To understand why graph technologies can help cyber security we are going to use a concrete example. Cisco has published a blog post that details how its graph analytics capability can protect customers against zero-day exploits. A zero-day exploit is a previously undiscovered security flaw in a software. Between the moment it is discovered and until the software is patched by those who use it, hackers can use the flaw to compromise systems.
A common technique is phishing. A criminal masquerades as a trustworthy entity to obtain sensitive information. We are going to study an example of this.
Recently Internet Explorer zero-day exploit (CVE-2014-1776) was used in phishing attacks. The hackers sent mails to victims who were asked to login into a website where their identification information was captured.
One of the domain used by the hackers was inform.bedircati.com. Among the other domains were profile.sweeneyphotos.com, web.neonbilisim.com and web.usamultimeters.com. Security providers quickly blocked these domains. In addition to this, Cisco was able to quickly identify other potential domains used by the hackers and protect its customers against them. Let’s see why.
As all web domains, the domains used in the phishing attack are linked to a couple of entities :
- an IP address : a numerical label assigned to each device (e.g., computer, printer) participating in a computer network that uses the Internet Protocol for communication ;
- a name server : a name server is a computer hardware or software server that implements a network service for providing responses to queries against a directory service (it turns a domain name into an IP address) ;
- a registar : an organization or commercial entity that manages the reservation of Internet domain names ;
The IP address are unique but the name servers and registars can link the domain names to other domain names. A graph model is ideal to represent these entities and their connections :

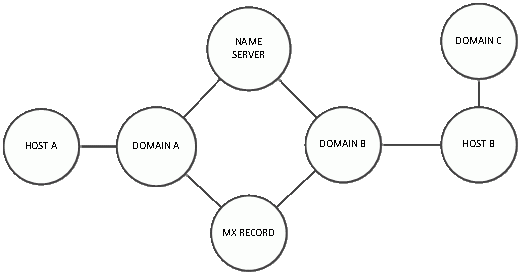
This model shows how easy it is to model our data with a graph. For Levi Gundert from Cisco :
« Within basic security analysis, we represent domains, IP addresses, and DNS information as nodes, and represent the relationships between them as edges connecting the nodes. In the following example, domains A and B are connected through a shared name server and MX record despite being hosted on different servers. Domain C is linked to domain B through a shared host, but has no direct association with domain A. »
Visually we can interpret the data in a glimpse.
As a cyber security provider, Cisco keeps track of the domain names. Through its data collection program, Cisco has good information on 25 to 30 million Internet domains. It knows which of these millions of domains are controlled by hackers and which are not. It might sound like a lot. But there is an additional 180 million domains on which Cisco has no information.
When Cisco was first alerted about the attack, it analyzed its data to find what the domains involved were connected to. Finding connections between entities in a large dataset is where graph databases are most useful.
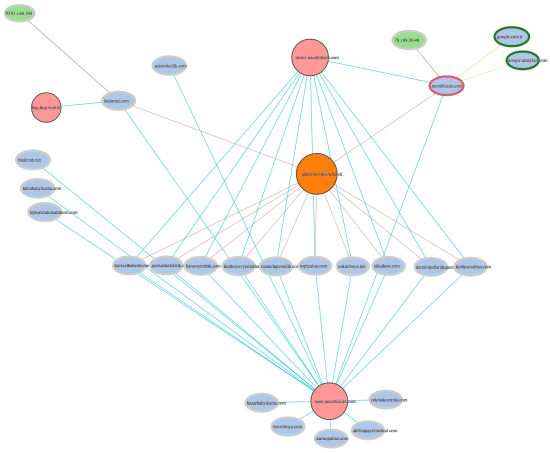
The schema below represent the result of the investigation Cisco conducted after the zero-day attack. Notice all the domain names in blue. Cisco started with two domain names but used graph analytics to identify 21 other domain names suspiciously linked to the first two.

We can see :
- 23 domains (light blue) ;
- 3 name servers (pink) ;
- 2 IP addresses (green) ;
- 1 registrar (orange) ;
The suspicious domain names can now be monitored so that they cannot be used in other phishing attacks. What is really impressive in this investigation is that Cisco was able to quickly block domain names before they were used by the hackers.
Graph technologies like Neo4j, GraphLab or Titan can help analyse large graph datasets quickly. Graph visualization solutions like Linkurious complement this by making the insights derived from graph analytics easy to interpret.
Michael Howe from Cisco, explains that using edges and nodes to represent the data is very important :
« That is the common terminology that people prefer to use. Going back to high school geometry, this is a very intuitive notion of how relationships exist and it’s very generic. Now we can describe things in terms that everyone is familiar with, we don’t have to appeal to more complicated descriptions. This allows everyone to discuss data relationships and how future data should be pursued. For example, in the information security world, we have network level data such as IP addresses, domains, DNS records, WHOIS information, etc. and as we begin to populate that data into a graph model, we start to see the holes and everyone can communicate very clearly about what they see. »
A common pitfall though is to try to always look at all the data at once. It might sound seducing (“I’m looking at everything so I’m sure I’m not missing something”) but is ill-advised, especially for large datasets. According to Michael Howe :
« When we deal with large data sets — say millions or billions of nodes and a high level of connectivity between nodes – the visual perspective isn’t as useful at that scale; it’s just too much information to process. Yet anytime that we have a smaller collection of entities we can effectively ignore the rest of the graph and look at that smaller scale – like one hundred nodes – and really engage the higher level complex thoughts from security professionals who aren’t necessarily experts at development work or the peculiarities of database implementations. We know that everyone who looks at a graph will understand it, since it’s a universal translator. »
To get the most out of visualization, the analysts should be focused on specific subsets of their data. As in the graph visualization of the zero-day exploit.
Cyber security is a huge challenge. Today, the emerging graph technologies offer new ways to tackle security data and use it to prevent attacks or react faster.
A spotlight on graph technology directly in your inbox.

