It’s one thing to produce documents and another to produce knowledge. Graphs can help extract interesting information out of documents and add an extra layer of information in a knowledge management system. Let’s see how to turn metadata into insights with Neo4j!
Organizations usually have an easier time producing documents than building knowledge. They store and give access to their employees to vast collections of presentations, text files, videos, mails, etc. Nevertheless, someone looking for an answer on a precise subject might have a better chance just walking around in the office and shouting is question. It is simply very difficult to make the information stored in documents easily accessible to the people who need it.
Graphs and graph visualization can offer an interesting approach. Electronic documents have metadata. That data about the data provides information such as the purpose of the data, the time and date of creation, the creator or author of the data, the location on a computer network where the data were created. Metadata can help us link particular documents to authors, locations, dates, topics. All of a sudden, we are not looking anymore at isolated documents but at a graph.
We are going to see that the graph paradigm allows to leverage the connections between the documents. It adds an extra layer of information in a knowledge management system : it can be used to identify important topics, experts, make suggestions…
In order to study the impact of graphs on knowledge management, we are going to take a concrete example. Deepesh Kuruppath has created a nice GraphGist project revolving around epublishing and graphs. We are going to use it for our use case.
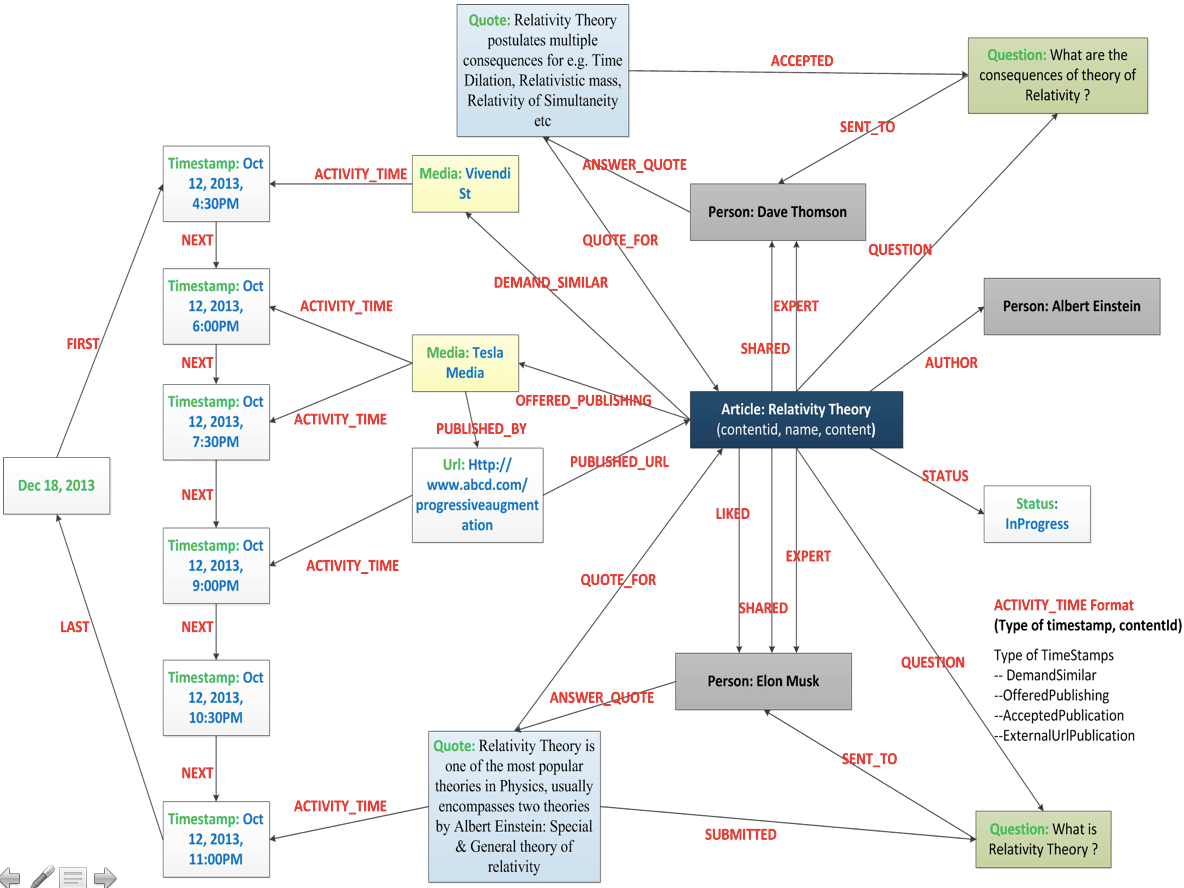
In our model, we are going to have several entities :
- Article: an e-published document
- Author: a type of person who writes articles
- Expert: a type of person who contributes to an/multiple articles
- Media: a type of media who demand articles and publish them
- Url: the url of a published article
- Question: queries raised/posted by Authors
- Quote: answers posted by Experts to Questions
- Status: status of an article (InProgress, Completed, Published)
- Trend: timeline of activities for e.g. when was an article written or conceived, when was it published, who is demanding the article etc.
All of these entities are linked together and form a network or graph. Here is a look at the data model for our use case :
Data modeling is the first part of a graph project. It will allow us next to query the data intelligently.
For the purpose of this use case, we are focusing on one article on relativity theory. What insights can we gain from it? In order to ask questions about, the graph we are going to use Cypher. It is the query language of Neo4j, the leading graph database and the best way to store graph data.
We can use Cypher to see who is the author of the article :
MATCH (n1)-[:AUTHOR]->(x)WHERE n1.contentId=’ART000001’RETURN n1.name AS Article, x.name AS AuthorThe results is Albert Einstein. What we have done here is look at the article, traverse the graph by following the “AUTHOR” relationship and grab the result. Simple enough.
No let’s look at the data from an other angle. We don’t want to focus on a particular article but we want to find an expert on the topic of relativity theory. The question is fairly easy to ask with a graph model. It is simply a matter of pulling out all the persons linked to the relativity theory article :
MATCH (n1)-[]->(x:Person)
WHERE n1.contentId=’ART000001’RETURN x.name AS Expert
The results are :
Using graphs to sort and rank documents is actually not uncommon. Google became popular thanks to the PageRank algorithm. The algorithm named after Larry Page, a Google co-founder, was used by Google Search to rank websites according to their importance. According to Google, “PageRank works by counting the number and quality of links to a page to determine a rough estimate of how important the website is. The underlying assumption is that more important websites are likely to receive more links from other websites”. This is graph theory at work.
Graph technologies make it possible to ask smart questions about the connections in your data. Sometimes though, simply seeing the data as a graph is helpful. You probably have used Wikipedia. If you are curious, by the time you have finished to read an article, you have opened a few tabs. The nature of Wikipedia encourages this : in each article, there are links to other articles. A reader curious to learn about a topic can start with an article and quickly discover new articles as he reads.
From the article Marcel Proust for example, you can go to le Père Lachaise, Le Figaro or l’Alsace.
Wikipedia itself is a graph. It stores articles and maps their relationships. The only trouble is that the underlying graph is complex. Simply browsing it with a navigator can thus be frustrating. After having read a few articles, you might lose track of your “path”. It is also harder to build an overall picture of the way the articles you have read are linked. Lastly, you have no idea about the context of your search : what are the articles that are linked to the ones you’ve read AND that you haven’t read yet? What are they connected to?
A graph visualization exploration could help with these issues. That is where Wikiweb comes in. This application applies graph visualization to Wikipedia.
The experience is certainly interesting. It allows you to dive in the vast Wikipedia dataset while maintaining a clear overall view. You can see how articles are connected : it helps you associate ideas in your memory and discover new content. Try it but be warned : next time you have to find content in a traditional knowledge management solution, you will be frustrated!
Now graph technologies are easily available. Modeling documents metadata with a graph can help add an extra layer of information. Together with graph visualization, it can foster the discovery of information.
A spotlight on graph technology directly in your inbox.