Media4Change: Fostering public sector transparency and press freedom with graph visualization
Media4Change is an international organization dedicated to issues at the intersection of human rights, investigative journalism, and media literacy. One of their hallmark projects is Karštos pėdos, which provides transparency around the connections between politicians and public figures and public-sector funding to journalists and to the general public.
In the context of this project, Media4Change adopted graph visualization and analytics technology to provide an easily accessible tool for their users to dive into the data they make available on their platform. In an unwelcome plot twist, Media4Change faced an uphill legal battle for the right to continue their project - a stark illustration of the resistance of some people in power towards public transparency initiatives.
The Karštos pėdos project also provides a great model for other organizations or government agencies who might want to replicate these efforts to bring more transparency to more people in their own country or region.
Public transparency efforts have sometimes made a lot of noise in recent years as organizations leverage data to unmask corruption and other shady behavior. Investigations by organizations like the ICIJ - such as the Panama Papers or the Pandora Papers - have instigated public scandals, resignations, and changes in legislation. At the heart of those investigations are large masses of data, often from many different sources.
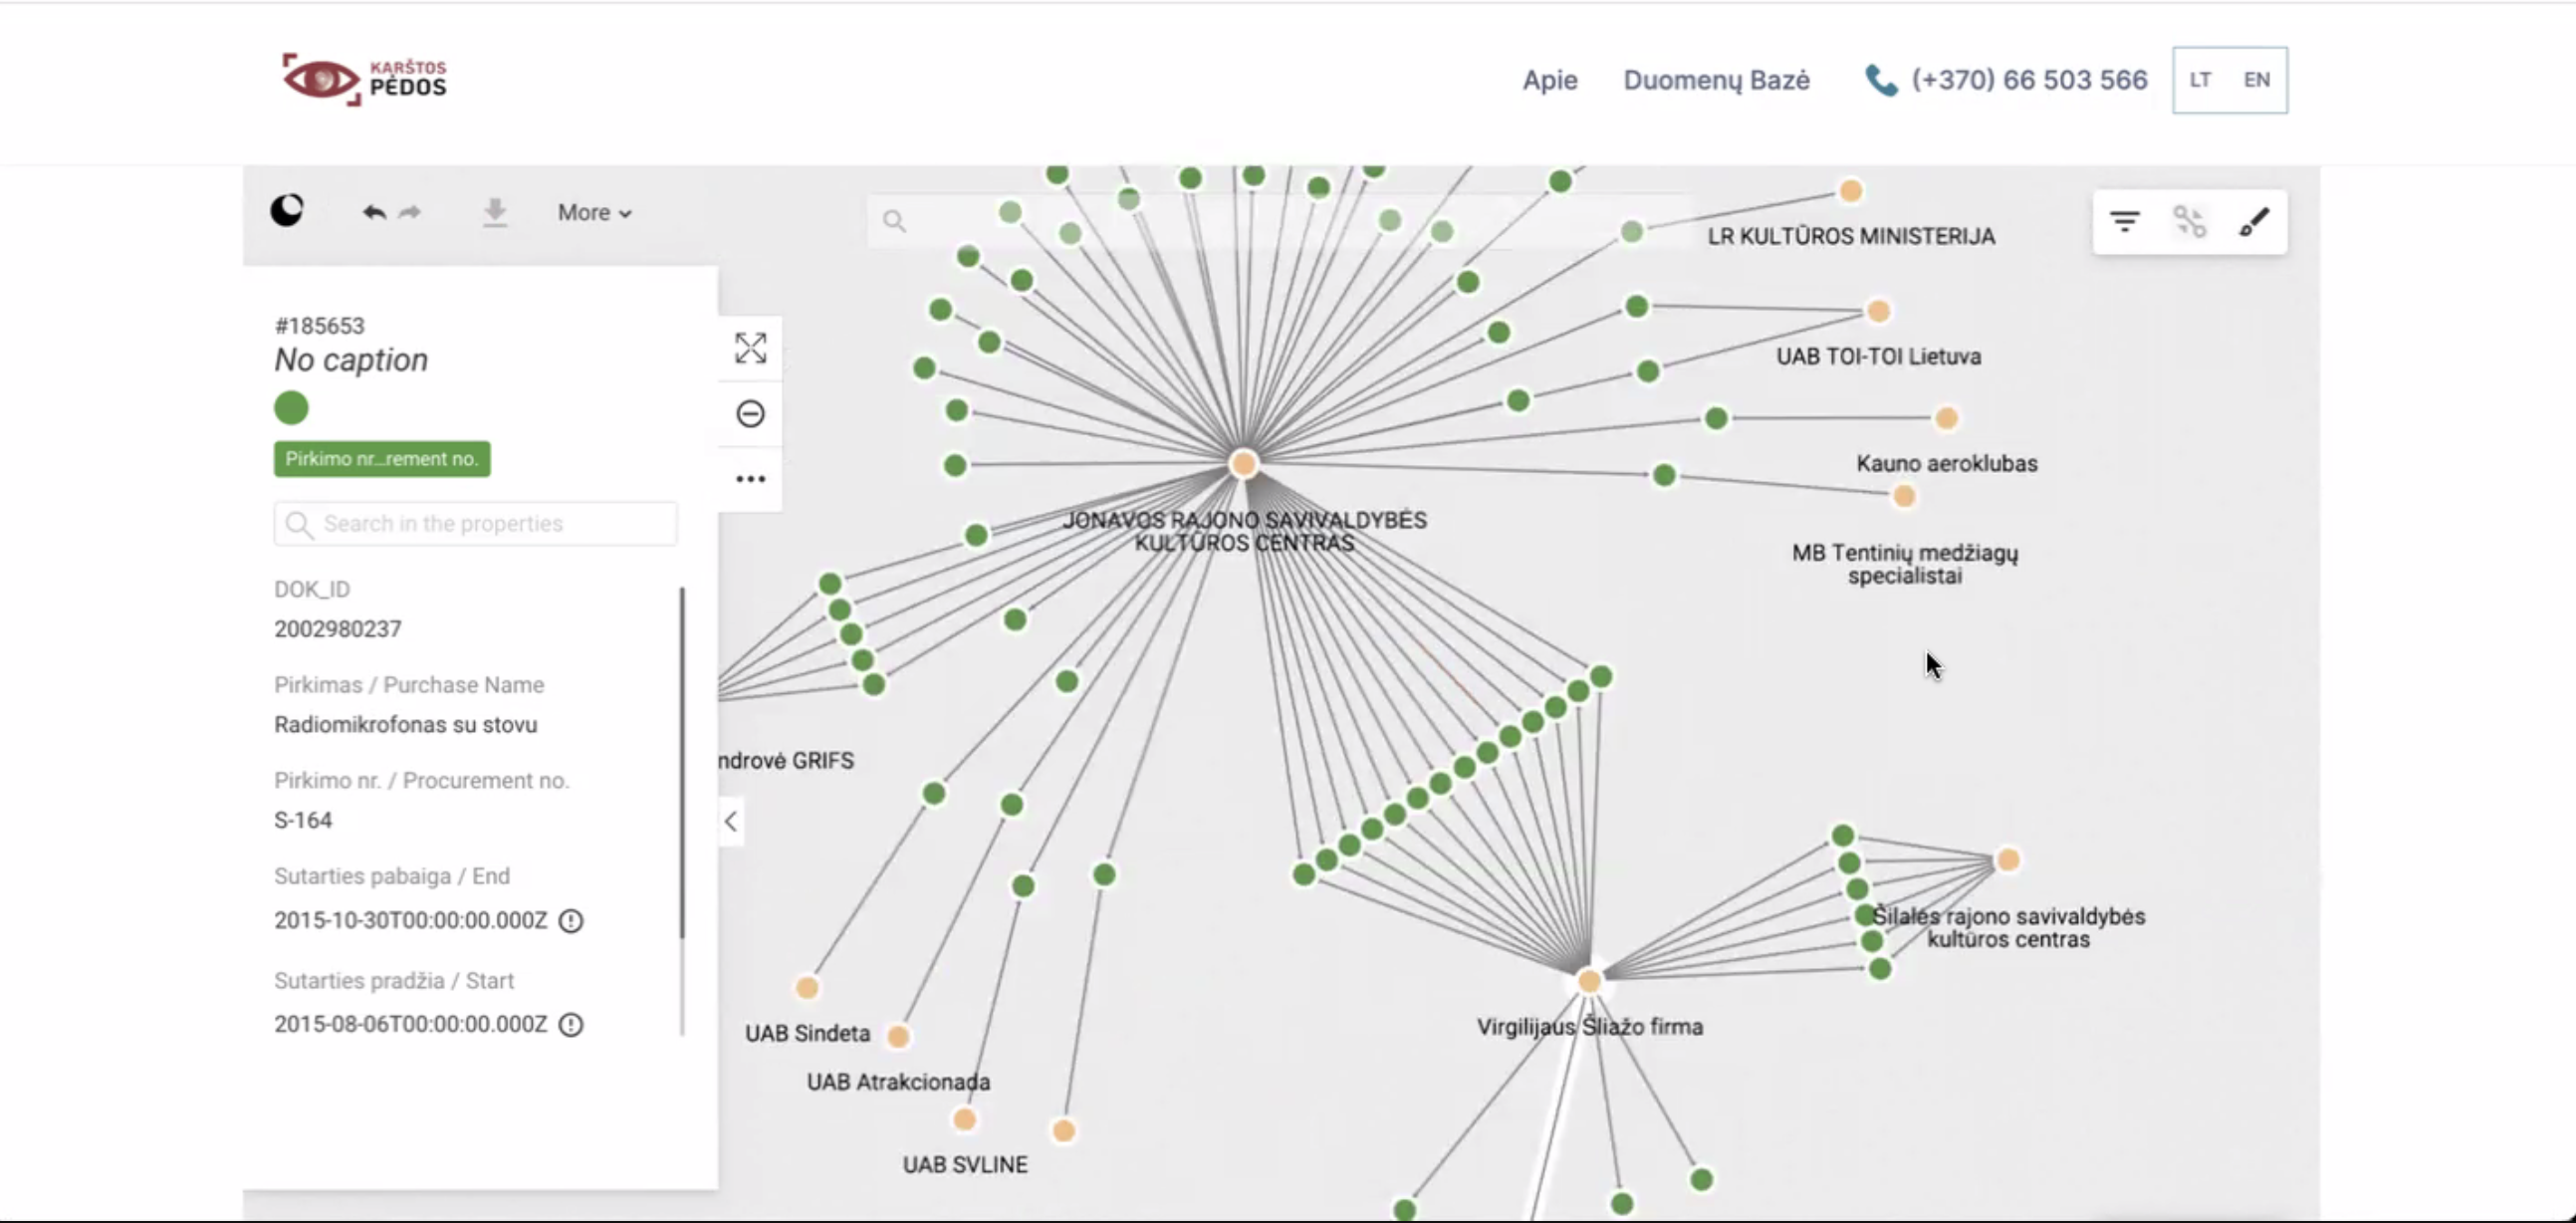
In Lithuania, Media4Change built a tool to put data related to public-sector financing in the hands of the press - and the general public - for the sake of transparency and to combat corruption. Their innovative transparency tool, Karštos pėdos or “Hot Feet” lets users explore the connections between politically exposed persons (PEPs), legal entities, and public money in a few clicks. Among other data, their tool combines public procurement data and European Union funding data. All together, this represents billions of euros in funding. The team is working on adding even more data sources to their tool.
To transform their data into a practical tool for journalists and other users looking to understand public financing patterns, the Media4Change team needed a way to make it easy to search and explore. Seeing the connections within the data was also key to understanding if anything suspicious was going on.
For this, Media4Change turned to Linkurious Enterprise for graph visualization. In a graph data model, the relationships within the data take center stage. Individual data points are represented by nodes, and the connections between those data points are represented by edges. Visualizing data as a graph makes it much faster and easier to understand how the data is related. Surfacing important connections, suspicious patterns, and anomalies becomes much more efficient and intuitive.
Leveraging graph visualization had the intended impact for the team at Media4Change. Using Linkurious Enterprise made it possible to process huge amounts of data in a short amount of time and saved hours and days of work tracking down key connections. “Without this tool, the project wouldn’t be possible,” says Sarunas Cerniauskas, the investigative journalist leading the Karštos pėdos project. “It brings value both for journalists and the general public.”
Organizations working with public-sector transparency sometimes learn that the people in power - often those with something to hide - don’t appreciate having a light shining on their activities. For Media4Change, this resistance manifested in the form of a difficult legal battle. The Lithuanian data protection authority didn’t recognize their initiative as a journalistic project in the public interest, and threatened the organization with an expensive fine while trying to force them to remove their platform.
This put a pause on the project for a year and a half, until the national journalism authorities deemed Karštos pėdos was in fact a journalism tool. It can now be used once again across the EU - and sets a legal precedent for other such tools.
Three major upcoming elections in 2024 will be a big test case for the Karštos pėdos project, as journalists can tap into the data within to uncover information about politicians or candidates that would otherwise have been challenging to uncover. The tool holds a lot of potential for investigating the parliamentary elections in particular, where there are many candidates and many connections to investigate.
Media4Change’s model is relatively easy to replicate in other places. Their platform relies on publicly available data - the kind that is available in many other countries, particularly in Europe. As the Media4Change team found, it's challenging to investigate that type of data without the right tools.
Building a graph visualization platform enables you to combine various data sources to analyze them in one place. It makes it faster and more intuitive to track down the important connections within public-sector data, putting transparency into the hands of journalists and citizens. Visualizations are also easy to understand and to share, helping make relevant information available to anyone who needs to see it.
By equipping individuals with the tools to navigate and interpret complex data, projects like Media4Change’s Karštos pėdos not only promote transparency but also foster a culture of informed engagement and accountability. This model, with its emphasis on accessibility and comprehensibility, is not just a tool but a catalyst for change, inspiring communities to demand and maintain higher standards of transparency in public affairs.
A spotlight on graph technology directly in your inbox.