Network management is a use case where graph databases and graph visualization solutions like Linkurious can greatly help. With a concrete example, we are going to see how graphs are the perfect tool for impact analysis and network maintenance.
Operating an enterprise network is no easy task. It involves keeping track of a continuously evolving set of servers, processes or services. All of this is expected to operate continuously.
When it doesn’t, it can result in :
- diminished productivity for employees ;
- loss of business and insatisfaction from customers and partners ;
- and even worse in some sectors (health, transport, military) ;
For example, in September 2010, Virgin Blue’s airline’s check-in and online booking systems went down. The outage lasted about 11 days. It affected around 50,000 passengers and 400 flights. The estimated cost for Virgin Blue? Around $20M.
Network management is critical but oftentimes this function is operated in poor conditions. Pressure from the business to deliver new services, evolving infrastructure, poorly documented assets, security threats : too often network management is accomplished in a perpetual state of urgency.
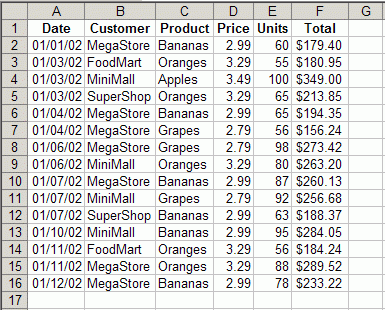
In a tabular oriented world, networks are represented through tables and lists. That kind of schema is adapted for domains where data is voluminous and homogeneous (example : sales report, payroll data). In this case, it makes sense to use the table as a data unit : it aggregates many similar records in a single data structure. Although it is possible to model a network via tables and list, it is not convenient. A network is made of nodes that are connected by relationships.


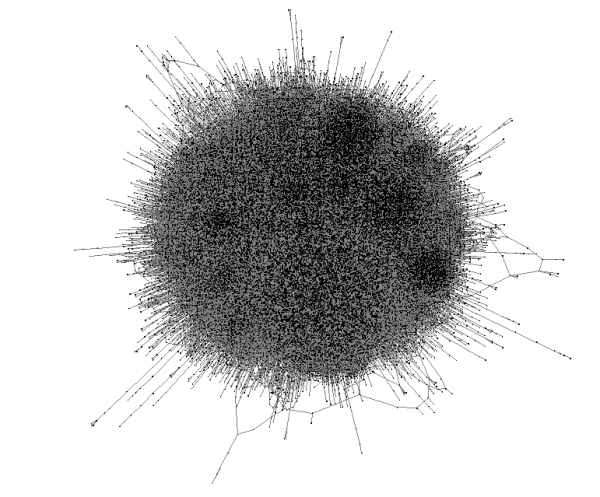
Real life networks tend to be messy. In a enterprise network for example, the network will evolve constantly when new equipment that have unforeseen characteristics is added or new connections are created. Keeping track of through tables is an enormous challenge.
On the contrary, a graph models very closely the heterogeneous nature of modern IT networks.
Using graphs instead of tabular data to think about data management can have a huge impact. Take maintenance for example. It consists in performing repairs and upgrades or taking measures to make the network run smoother. This requires a precise understanding of the network and its dependencies. If you don’t know which service relies on which equipment, how can you operate a network? This sounds logic but we live in a tabular-oriented world.
In a tabular oriented world, in order to plan an intervention, an IT administrator has to :
- manually collect data across multiple sources to build a unique representation of the network (a sub-part of the whole enterprise network) ;
- analyse the result manually, studying possible outcomes (“what happens if I plug this out?”) ;
- choose the best course of action to execute the intervention (and minimize downtown) ;
Any error during these steps will result in risks and a simple outage can have escalating consequences. The biggest threat usually lies with the data : it is often incomplete, false or missing. It results in a imperfect picture of the network…and unpredictable results for maintenance interventions.
In order to see what using graph technology can bring to network management, let’s turn to a GraphGist example compiled by Kenny Bastani. It shows how to use Neo4j to store and analyse a company network with a concrete example. I recommend you go read the article.
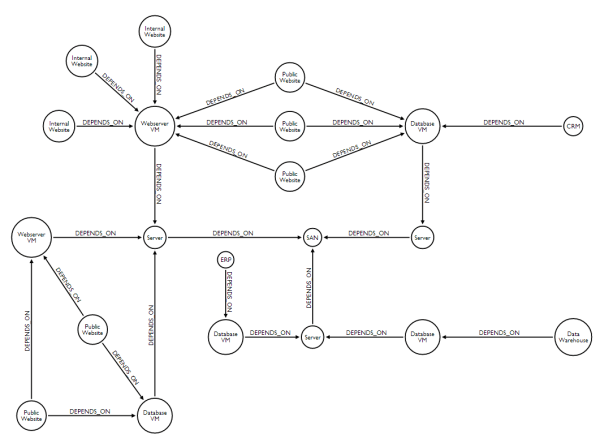
The network in this example is composed of applications (a CRM, an ERP), websites (a support website, a company website), various intranets applications, web servers, database servers, hardware servers and a storage are network (SAN). The different components of this network are linked through dependency relationships.
Here is a look at a schema :

Let’s say that an IT administrator wants to know whether he can temporarily disable a database server to upgrade it. With the data stored in Neo4j, it is easy to answer quickly. To do that, we are going to use Cypher, a query language designed for graphs. Here we want to know which applications are going to be impacted when we remove a particular physical server. The server we are interested in is called ‘HARDWARE-SERVER-3’ and its IP address is ‘10.10.35.13’.
MATCH (application:Application)-[:DEPENDS_ON*]->(server)WHERE server.host = “HARDWARE-SERVER-3”
RETURN application.type as Type,
application.host as HostThis Cypher query returns the list of applications impacted by the removal of ‘HARDWARE-SERVER-3’ : a data warehouse and an ERP. We know that to proceed with the server upgrade, we have first to find a temporary server to maintain the applications. Alternatively, we can plan the intervention and warn the applications users.
If you want to try this on your own, you download this dataset and load it in Neo4j.
Using graph technologies for network management is a great idea. It makes the data modeling easier and more flexible. The result is a higher quality of data. Furthermore, with a graph database like Neo4j, you can query the data intelligently. This way you can understand the full impact of your maintenance operations.
The results can be great :
- lower risk of network outages for the company ;
- network management teams spend less time parsing inaccurate data and more time providing great network performances ;
- greater organizational agility (it is easier to remove and upgrade equipment and services to follow business requirements) ;
So what does it take to apply this in the real world? That’s where graph visualization solutions like Linkurious come in handy. Graph visualization helps network management team interact with their network in a visual and interactive manner. This way they can access the power of graph technologies without having to actually know how they work.
In this article we have seen one example revolving around impact analysis as it applies to network maintenance. But the potential use cases for graphs in network management are greater : network optimization, asset management, inventory mapping, etc. Network management is intrinsically a graph problem. The moment you start treating it as such, it becomes much easier!
A spotlight on graph technology directly in your inbox.

