We’re always working on features and updates to make Ogma work better for you. In the brand new Ogma v3.3.0, our team is introducing a new way to add information to your graph visualizations, the annotation layer. We have also worked on performances to make your projects even faster. Finally we also shipped brand new features that you will love, but no spoilers: get the lowdown on everything that’s new below!
The Ogma library provides developers with a toolbox to draw a graph on a web page. With different options to customize the style, positions or interactions associated with the nodes and edges, it’s easy for developers to create rich experiences. But what if you want to add even more information to your visualization? The annotation layer provides a blank page for developers who want to enrich a graph visualization powered by the Ogma library.
Want to overlay swim lanes on a hierarchical graph to indicate the different levels within the hierarchy? Want to add embedded comments within an application to provide context around what’s displayed? The annotation lets you integrate HTML blocks, images or Canvas elements within an Ogma-powered visualization.

The annotation layer is seamlessly integrated with the Ogma-powered graph visualization. When zooming or panning for example, the annotation layer stays synced with the rest of the visualization.

Ogma version 3.3.0 delivers better performance for the force layout via the autoStop option. The force layout uses a force minimization engine to layout the graph.
Our research led to the development of a stability metric, which allows the layout process to stop automatically when the graph is considered as stable. It represents a huge gain in performance. You can see the comparison yourself in the force layout example on v3.0.0 and the one on v3.3.0.
The first run of the layout takes 1 second instead of 2.4 seconds and the subsequent reruns take 0.3 seconds instead of 2.4s. This improvement allows more natural graph explorations, since redoing the layout of the graph on expand is now much faster. It also allows you to load and lay out huge graphs much faster, making the graph navigation experience seamless for end-users.

Last year, we introduced Visual Groupings as a new way to make sense of complex graphs.
To help you get more out of the feature, we wrote a new example for you! It demonstrates how to highlight connections between subnodes inside visual groups. The community has requested this feature and it requires an in-depth understanding of the Ogma API to build it yourself. Feel free to contact support if you have any trouble adapting this example to your solution.

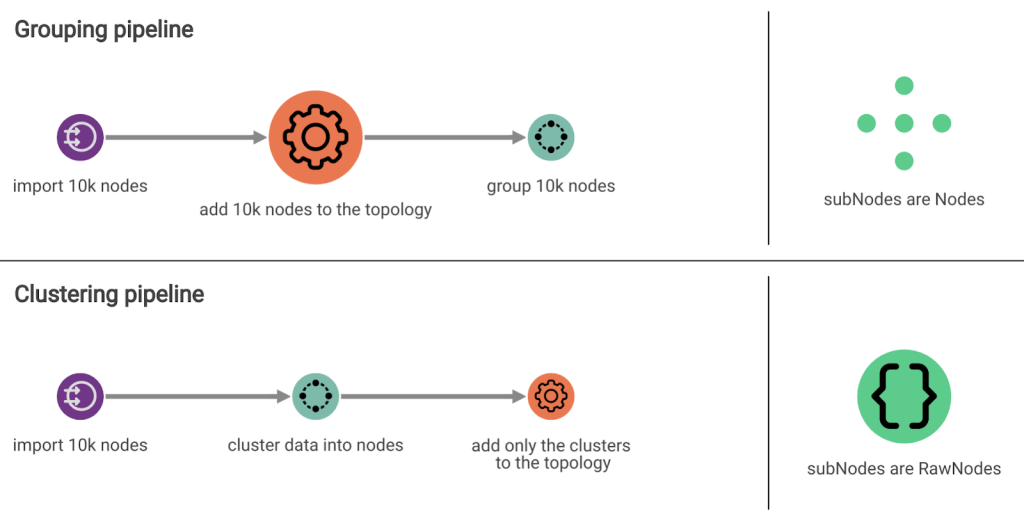
Ogma v3.3.0 comes with a faster approach to group nodes. The Grouping API let’s you reduce the size of the graph while still keeping the grouped nodes in memory. It’s great because you can display the graph of grouped nodes while retaining the ability to access the underlying data. This comes at a price, though, since the underlying data impacts the speed of the first layout and the subsequent interactions.
The newly introduced Clustering API provides a faster way to group nodes and interact with the graph.

How does it work? The Transformation API acts as a “middleware.” The nodes and edges it processes are parsed and turned into a smaller graph containing only the grouped nodes and their edges. The loading process is thus faster and each subsequent interaction with the graph is also accelerated. This means working with a grouped graph is now facilitated for end users.

Ogma v3.3 brings more customization possibilities, a faster import for larger graphs and a new option to lay out graphs at a very high speed. We hope you find the new features and updates useful. As always, please get in touch with us for any questions or if you’d like to learn more about these latest updates.
We already have new things in the works and can’t wait to show you what comes next!
A spotlight on graph technology directly in your inbox.


