Ogma 3.3.0 was all about optimization, but speed is nothing without style. That’s why we focused on visual quality for Ogma 3.4.0. We have new options for maps, better exports – plus new PDF exports – and delivered great new examples of how to enrich your visualization even more.
Ogma version 3.3.9 delivers a new example in the documentation showing how to export a visualization as a PDF document. This new export format will simplify your reporting and publishing workflow.
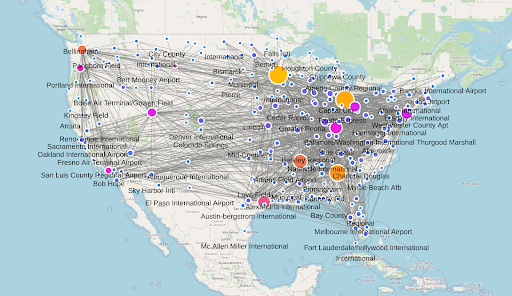
The Ogma library provides a way to display your graph on a map. But on large graphs, the map can quickly become unreadable. We created a new Grouping feature, allowing you to group nodes in geo mode according to the zoom. This brings more clarity, making sure your map always stays clear, and unleashes the full potential of geo mode visualizations. Check out our new example.
We’ve made our tutorials interactive to give developers better tools to learn Ogma. Until now, developers had to read the tutorials and then train on the playground. Now they can benefit from both extensive explanations and a playground within the same page. Want to learn how to integrate Ogma in React? Before you had to copy/paste the content of the tutorial into your own project. Now you can just check out the page and code straight away.
For this release, we focused on the quality of the images exported from Ogma. Texts and maps are now rendered exactly the same way in image exports as in the visualization. We have also improved the text overlap removal in geo mode. Now you can export any visualization powered by Ogma and be confident about the result: it will be exactly as you see it displayed in your Ogma-powered application.
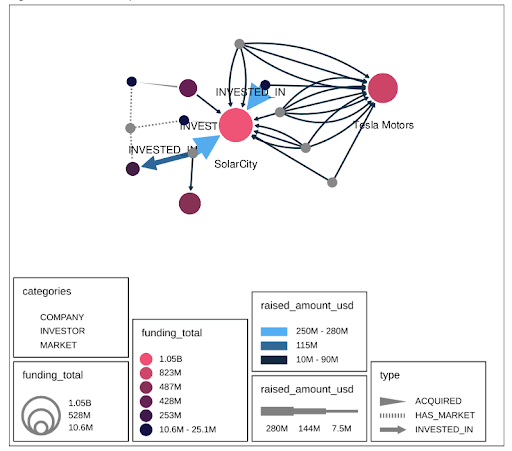
Ogma 3.4.0 provides a new example demonstrating how to display text on edge extremities. This is not possible with the regular text API but you can build it yourself through the layer API. You can choose where to place the text along the edges, change the content and even use icons!
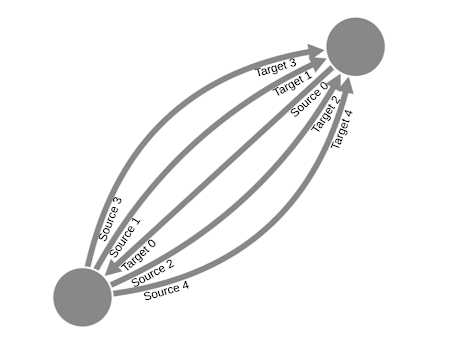
Ogma 3.4.0 provides new functions to help you build layers. Thanks to those functions, you will be able to compute the position, the tangent and the normal vector to any point on an edge. This will allow you to build more complex layers, displaying text and images on edges. Check out the geometry section of the API to get further information.
Ogma 3.4.0 brings more robustness, better visual quality and low level functions to unleash more beautiful and complete visualizations. As always, please get in touch with us for any questions or if you’d like to learn more about these latest updates.
We already have new things in the works and can’t wait to show you what comes next!
A spotlight on graph technology directly in your inbox.