Ogma v4.4 is out, and this is a big one - there are some truly exciting things in this release. The headliner for us is the GPU layout, which performs 2-6x faster, and at the same time providing more symmetrical, easier to read visualizations. But we’ve also published an example of real-time collaborative editing of the graph visualization, and there is a brand new Jupyter Notebook integration. Read on to learn more about what’s new with Ogma.
We are releasing our new version of general purpose layout implementation: GPU mode. Here’s a quick explainer.
GPU means that it utilizes the processing power of GPUs to perform the computationally intensive tasks required to calculate the layout. The advantage of that approach is that the graphics card can process large amounts of data in parallel, thus making the algorithm more performant.
It is very important because all the force-directed graph drawing algorithms have a bottleneck: calculating the repulsive forces exerted by nodes at each other. This means that at every iteration step of the algorithm running on a graph of N nodes we need to make N2 amount of operations in the worst case. Running these calculations in parallel on a graphics card can increase the performance of this task dramatically.
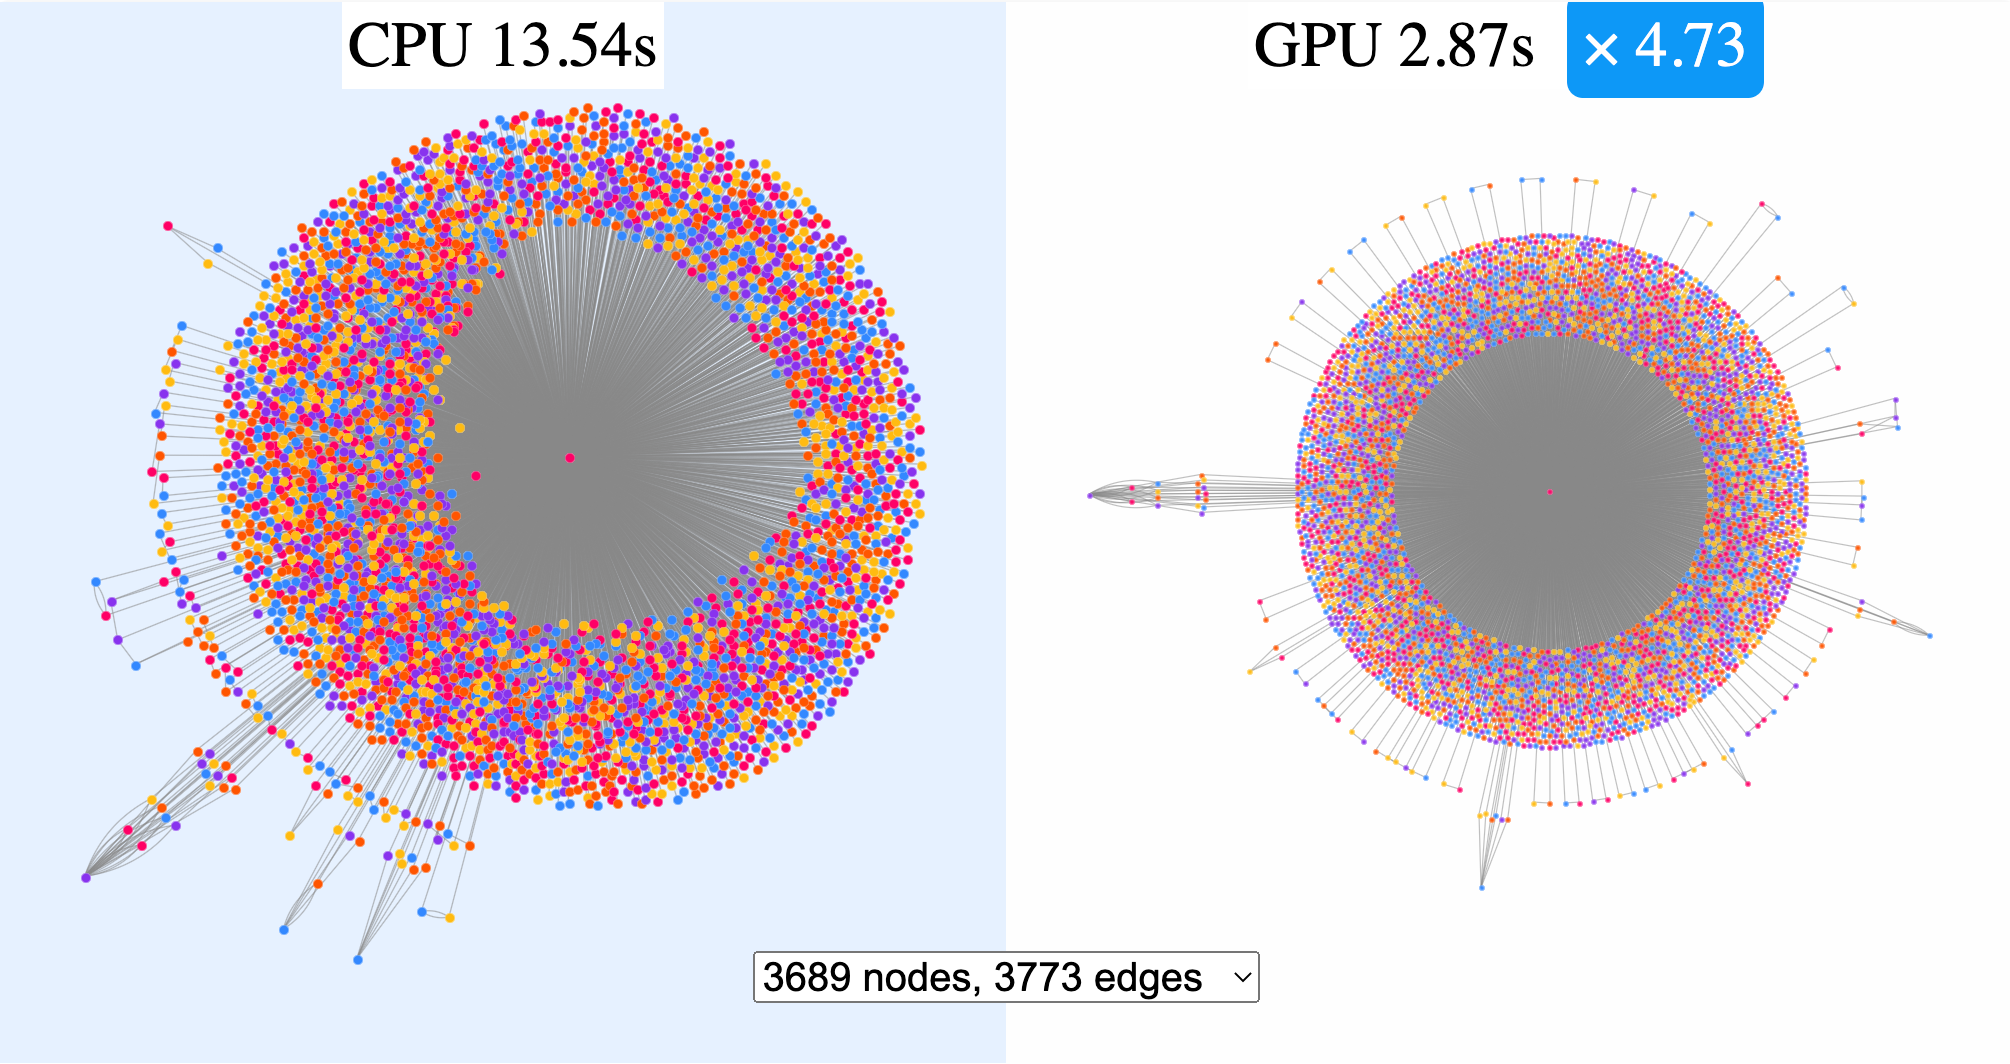
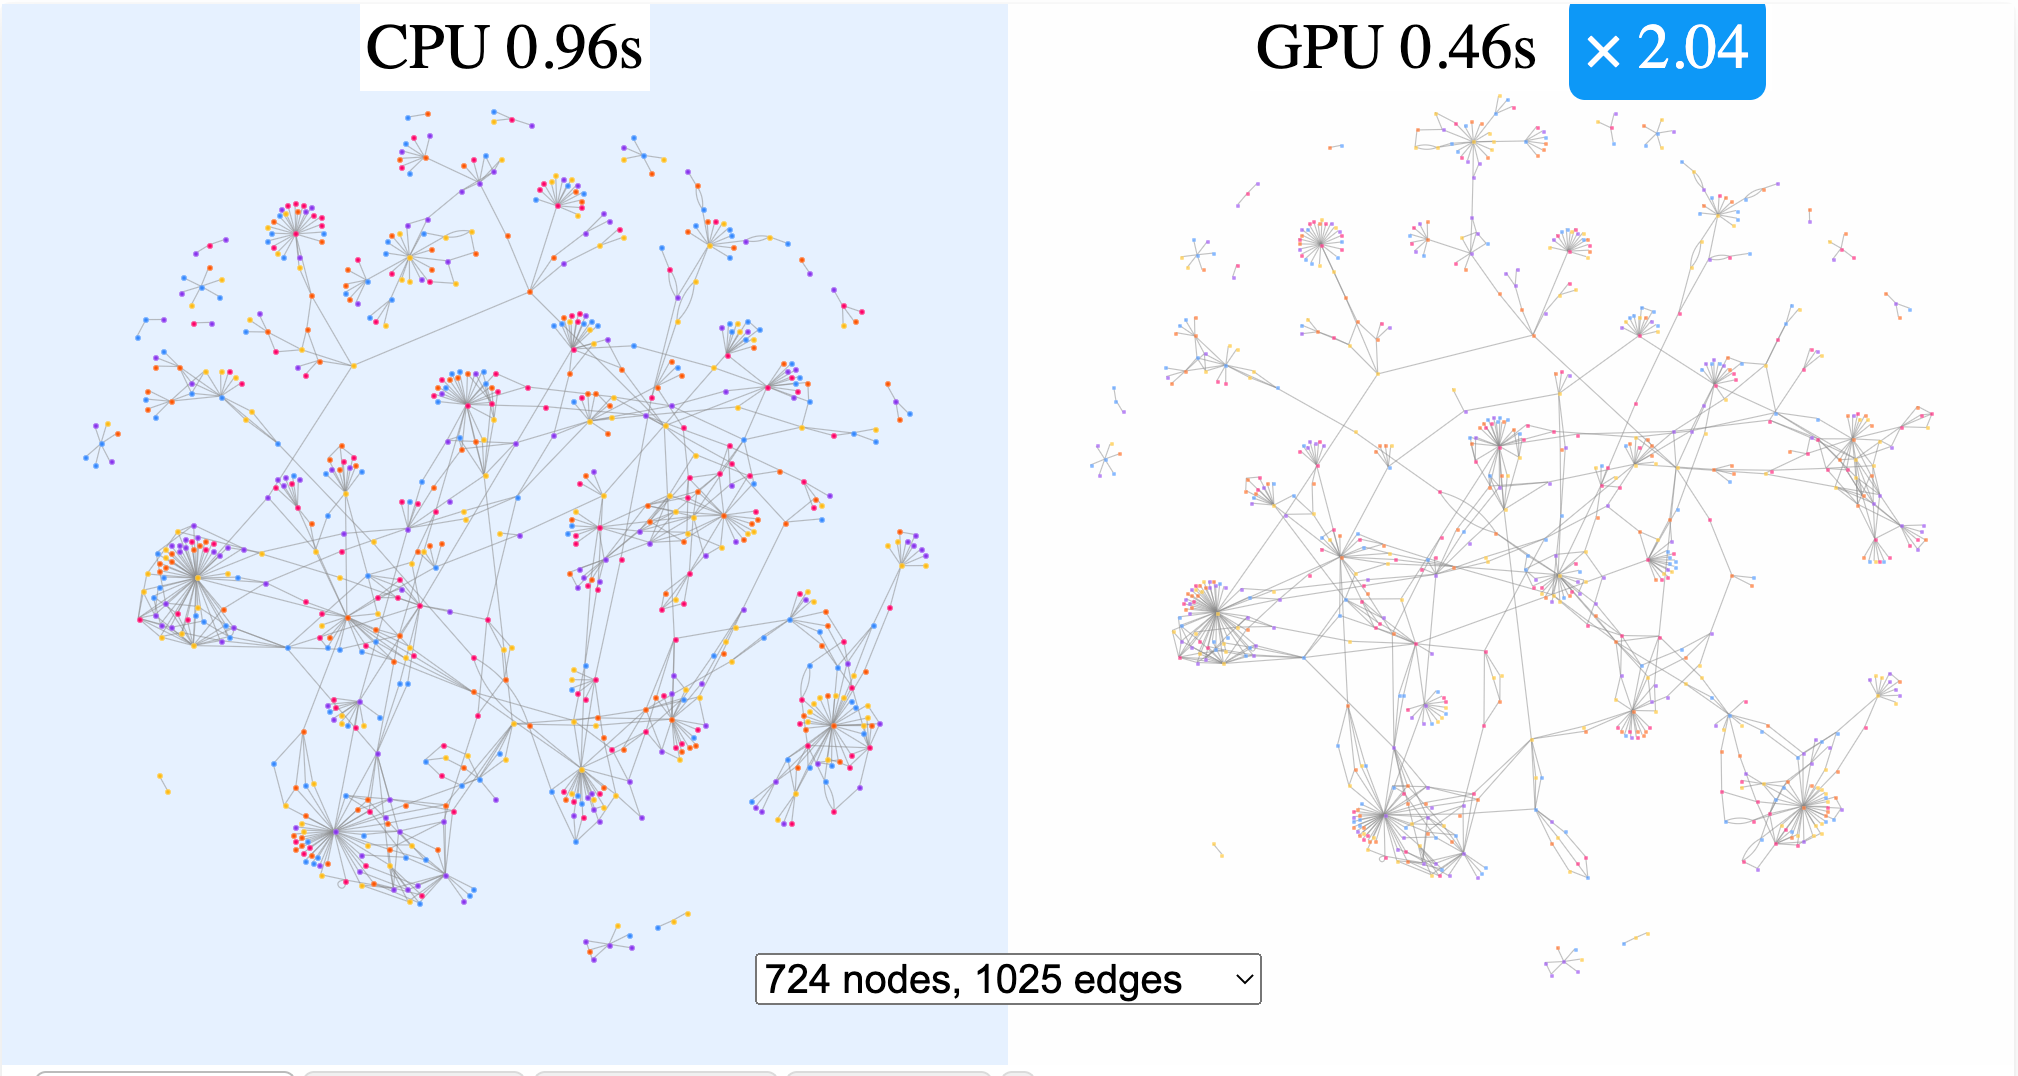
As a result, for a wide range of graphs, our benchmarks report 2 to 6 times shorter calculation time, while the algorithm precision is actually increased. As you can see on the image above, the layout on the right, calculated by the GPU layout, shows clearly visible symmetry and regular shape of the halo made of thousands of nodes connected to the central one, making the picture much easier to read.
Other than higher quality and performance, the layout has the same characteristics as the CPU version of our main general-purpose force layout. This means that you can try it interchangeably with the CPU version by just turning the GPU flag to true.
The version currently released is experimental, so it has its limitations, it performs best on graphs with 250-7000 nodes. Below or above this size the difference in performance will not be noticeable and the difference in quality will not matter much. We will continue our research to extend the use of GPU for larger graphs and offer greater performance later this year.
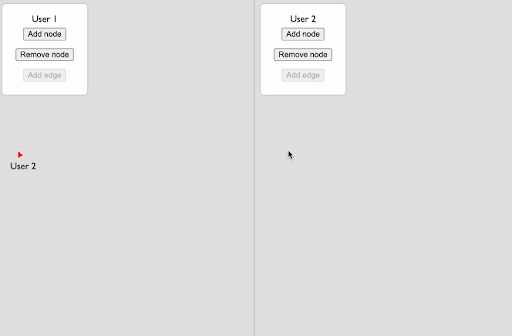
We have published an example of real-time collaborative editing of the graph visualization. It is designed to give you a feel of what you can do with your processes involving the graph visualization if you can enable real-time collaboration for multiple users.
Using CRDT (Conflict-free replicated data type) data structure and a simple broadcasting server you can do the same thing with your user input as we have done with our layout algorithm (read above): you can parallelize it! It’s only a proof of concept and we will be working on more solutions and behaviors involving this technology, but it’s easy to see the usefulness of it for your team investigation processes, or production of knowledge graphs when several people can add their insights to the the visualization and help others at the same time. And they don’t need time to synchronize as your visualization is now a collaborative board.
Feel free to reach out to us with your thoughts on what you would need to see further in order to plug that into your application.
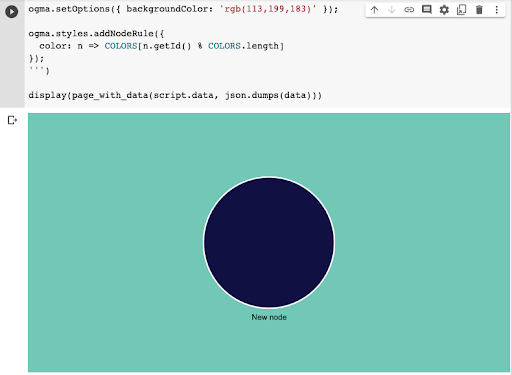
You can now use Ogma together with Jupyter Notebook to create interactive notebooks with embedded graph visualization blocks. This is a great way to make Ogma part of your data analysis or processing pipelines, and to create visualizations of your models.
In our latest tutorial we are explaining how, using a few standard python libraries and Ogma, you can create widgets with an interactive graph visualization inside your notebooks. In order to start off using Ogma in a Jupyter Notebook, you just need to import it as a Javascript library and a block, then load data, styles and behaviors, like layout, transformations or other things that you need.
Hundreds of examples of different behaviors are available as examples on our website, so you can customize your widgets according to the task at hand: load your data, then run a layout, add styles and interactive UI, run groupings or highlight paths between nodes. Like that you can illustrate the steps you take with your data, and check your hypothesis without having to switch tech stacks or working with static charts.
A spotlight on graph technology directly in your inbox.