Visualize your janusgraph database to find insignts with linkurious enterprise
Linkurious Enterprise supports the JanusGraph database. In this post, we explain how to connect Linkurious Enterprise to the JanusGraph distributed graph database to visualize connected data and find hidden insights.
JanusGraph is a graph database engine. This Linux Foundation–hosted project builds on a fork of TitanDB, a deprecated graph database.
For those unfamiliar with graph databases, they are database systems that store data using a graph structure. This particular structure consists of a set of nodes and edges (or relationships). Each node represents an entity such as a person, and each edge a relationship between two nodes, for example, “this person owns a bank account.”
Graph databases emerged as an answer to the shortcoming of the traditional relational database management systems (RDBMS), structured in tables with rows and columns. Contrary to relational systems, graph databases are flexible enough to store and manage data with complex relationships. They perfectly handle real-time queries and large-scale operations on today’s large networks of highly connected data.
JanusGraph is a distributed system, meaning that multiple instances can coordinate into one system to support very large graphs. JanusGraph graphs scale with the number of machines in the cluster and is thus optimized for working with graphs of hundreds of billions of nodes and edges.
JanusGraph is a database that can support many concurrent users executing complex graph traversals, or queries, in real time. They use Gremlin, a graph traversal language, for commands and queries. To handle large-scale analytical processing, such as running complex graph algorithms, JanusGraph supports the Hadoop framework for large-scale graph storage and analytics.
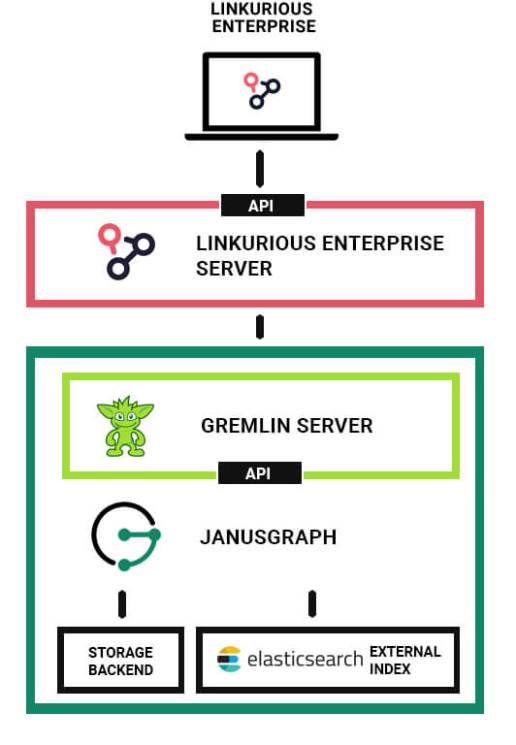
On top of JanusGraph, Linkurious Enterprise makes graph data and graph analytics results available to end-users through a browser-based graph visualization and analysis platform. Linkurious Enterprise can be plugged directly to JanusGraph, letting analysts and investigators explore, query, and visualize graph data without prior knowledge of the Gremlin traversal language.
JanusGraph is a distributed system, meaning that multiple instances can coordinate into one system to support very large graphs. JanusGraph graphs scale with the number of machines in the cluster and is thus optimized for working with graphs of hundreds of billions of nodes and edges.
JanusGraph is a database that can support many concurrent users executing complex graph traversals, or queries, in real time. They use Gremlin, a graph traversal language, for commands and queries. To handle large-scale analytical processing, such as running complex graph algorithms, JanusGraph supports the Hadoop framework for large-scale graph storage and analytics.
On top of JanusGraph, Linkurious Enterprise makes graph data and graph analytics results available to end-users through a browser-based graph visualization and analysis platform. Linkurious Enterprise can be plugged directly to JanusGraph, letting analysts and investigators explore, query, and visualize graph data without prior knowledge of the Gremlin traversal language.
 JanusGraph is an open-source project (Apache 2 license) and you can download or clone the latest version from Github. The installation process is straightforward, and an extensive documentation is available to help you. You can choose from different storage depending on your organization requirements.
You deploy Linkurious Enterprise on-premise or in the cloud and connect it to your JanusGraph instance by providing its address and credentials.
Another alternative is to connect Linkurious Enterprise to a JanusGraph instance deployed on Compose, a SaaS platform that offers easy-to-deploy JanusGraph instance in the cloud. IBM Compose uses ScyllaDB as a backend storage engine for JanusGraph.
At this point, your data is stored in JanusGraph but is searchable, editable and viewable as a graph in Linkurious Enterprise. This complementary combination of JanusGraph and Linkurious Enterprise helps you address all the stages of your graph project, from building, enriching and storing your graph data to making it available to your end-users for analysis.
Your users can now search, visualize and analyze complex graphs to reveal hidden connections. As we explained before, interactive visualization tools are an essential layer to identify insights. They are particularly useful in situations where end-users need to understand and identify complex connections, situations such as fraud or money laundering detection, cybersecurity or counter-intelligence.
Users access styling and filtering capabilities to reduce the noise, highlight key elements and analyze the data faster. They can also work with the information generated by your graph analytics engines directly in Linkurious Enterprise interface.
Several tools that don’t require prior knowledge of database technical languages are available to end users. The alert management system and pre-configured queries help them streamline the identification and monitoring of patterns in the graph data. This is useful in a fraud monitoring context for instance where you’d want to be notified when instances of known fraud schemes occur.
A spotlight on graph technology directly in your inbox.