Learn how WPO used Linkurious graph visualization software to help their sales team map the renewable energy market and generate more business.
WPO is a leading and independent expert-services platform specialising in technical advisory, site inspections, third-party asset management and insurance brokerage in the renewable energy sector (wind, solar, hydro). WPO interacts with a whole ecosystem consisting of project developers, investors, lenders, insurers, grid operators, energy off-takers, landowners, public officers & administrations, other advisors or services providers, etc. “The company delivers expert-services throughout the renewable energy projects’ life cycle in a fast-growing industry” explains Alexis Szepessy, IT project leader at WPO. This is why understanding the renewable energy ecosystem is of such importance for WPO.
For WPO, a recurring challenge has been to formalize, maintain and strengthen its knowledge of the renewable energy ecosystem. Traditionally, it remained with the company’s employees, and more specifically within the sales team. For instance, when a new company launched a renewable energy project, it would strive to identify potential contact points within that company and its business partners. However, communication appeared ineffective without formalized knowledge management and time passing, or when a member of the sales team would leave WPO, parts of WPO’s knowledge of the market would be lost.
To capitalize knowledge and consolidate the company’s expansion, WPO decided to actively map out the renewable energy ecosystem. Not on Post-It®, or MS-Excel spreadsheets; Nor on SQL database. But on Linkurious !
The first step and potentially the simplest was to formalize a data collection process. Indeed, the sales team would be systematically required to take specific notes during meetings with clients relating to important industry relationships (ie. Company A owns asset X, project X is funded by bank A, etc.). In time, this would provide the necessary information to build a comprehensive take out hand-made representation of the market.
It quickly became clear that the relational technologies used by WPO, a CRM and an SQL database, or even mind-mapping software would not be sufficient to store and represent this data. WPO decided to resort to using the Neo4j software to overcome this limitation. Although the sales team had never used a graph database, they appreciated the software’s ability to store and intuitively generate queries from their data.
As the sales team was not experienced in using Neo4j, it was decided that Linkurious would provide an easier way to interact with data.
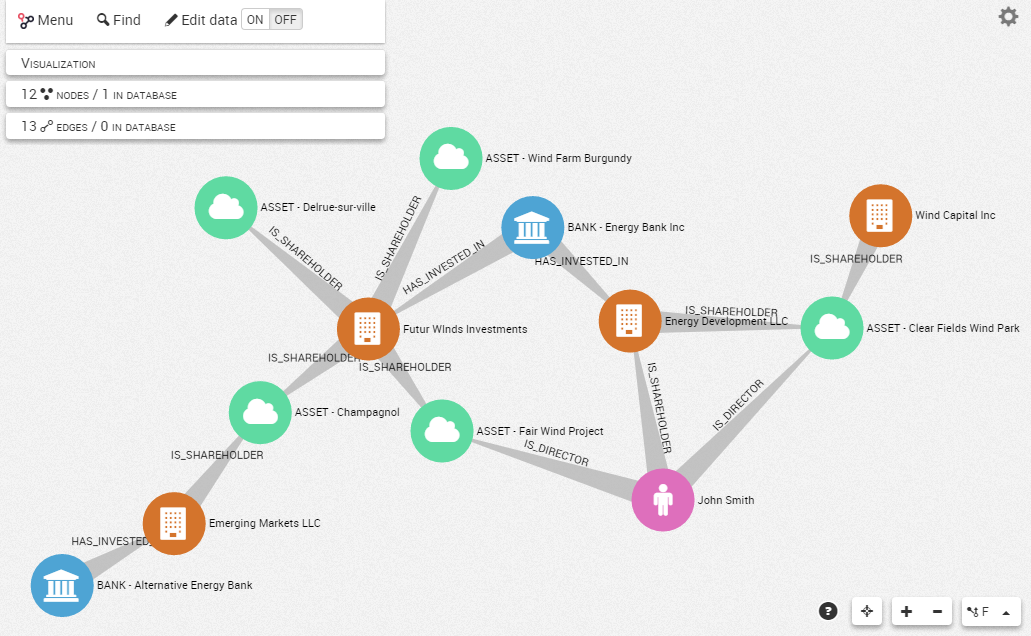
“Linkurious allows us to enter and store information relating to important nodes and relationships easily. We can also visualize in a very friendly manner the content of our data and answer questions like “what are the companies involved in this opportunity? who should our sales team contact?” which is key for us” comments Alexis Szepessy.
Currently, WPO is in the process of mapping the European renewable energy ecosystem. When completed, WPO’s management would like to expand the use of Linkurious throughout all WPO employees and not only its sales team. “We want our map to become the strongest asset of the company. With this deeper understanding of the market we will find leads and create opportunities more effectively than any of the other competitors, and certainly be in capacity to bring more opportunities to our clients than they are capable of sourcing themselves!”
A spotlight on graph technology directly in your inbox.