Fraud detection is all about connecting the dots. We are going to see how to use graph analysis to identify stolen credit cards and fake identities. For the purpose of this article we have worked with Ralf Becher, irregular.bi. Ralf is Qlik Luminary and he provides solutions to integrate the Graph approach into Business Intelligence solutions like QlikView and Qlik Sense.
Third party fraud occurs when a criminal uses someone else’s identity to commit fraud. For a typical retail operation this takes the form of individuals or groups of individuals using stolen credit card to purchase high-value items.
Fighting it is a challenge. In particular, it means having a capability to detect potential fraud cases in large datasets and a capability to distinguish between real cases and false positives (the cases that look suspicious but are legitimate).
Traditional fraud detection systems focus on threshold related to customers activities. Suspicious activities include for example multiple purchases of the same product, high number of transactions per person or per credit card.
Graph analysis can add an extra layer of security by focusing on the relationships between fraudsters or fraud cases. It helps identify fraud cases that would otherwise go undetected…until too late. We recently explained how to use graph analysis to identify stolen credit cards.
For the this article, we have prepared a dummy dataset typical of an online retail operation. It includes:
- order details: product, amount, order-id, date;
- personal details: first name, last name;
- contact info: phone, email;
- payment: credit card;
- shipping: address, zip, city, country;
- tracking: IP address.
To analyse the connections in our data, we stored it in a Neo4j, the leading graph database. The graph approach lies in modelling data as nodes and edges. Here is a schema of our data represented as a graph:
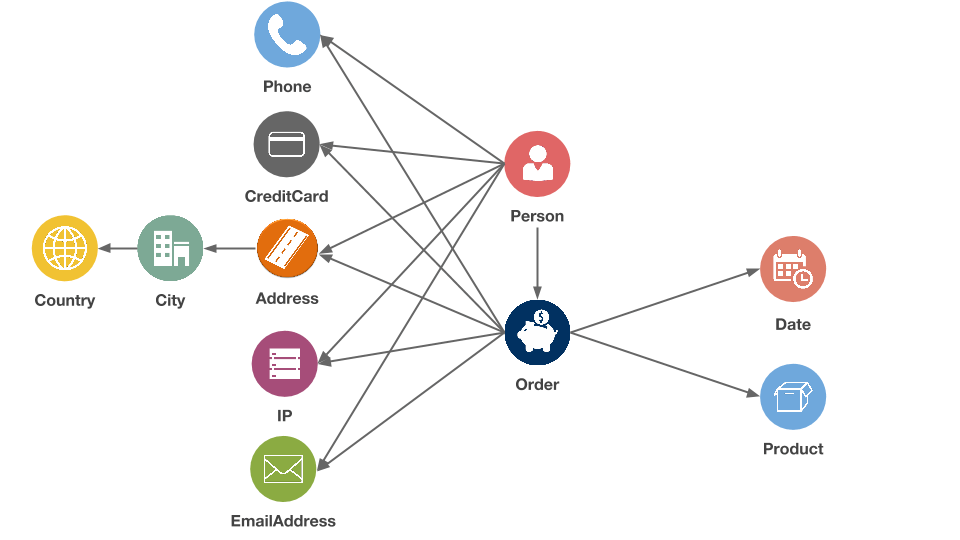
You can download the data here.
Now that the data is stored in Neo4j, we can analyse it.
First of all we need to set a benchmark for what’s normal. Here is an example of a transaction:
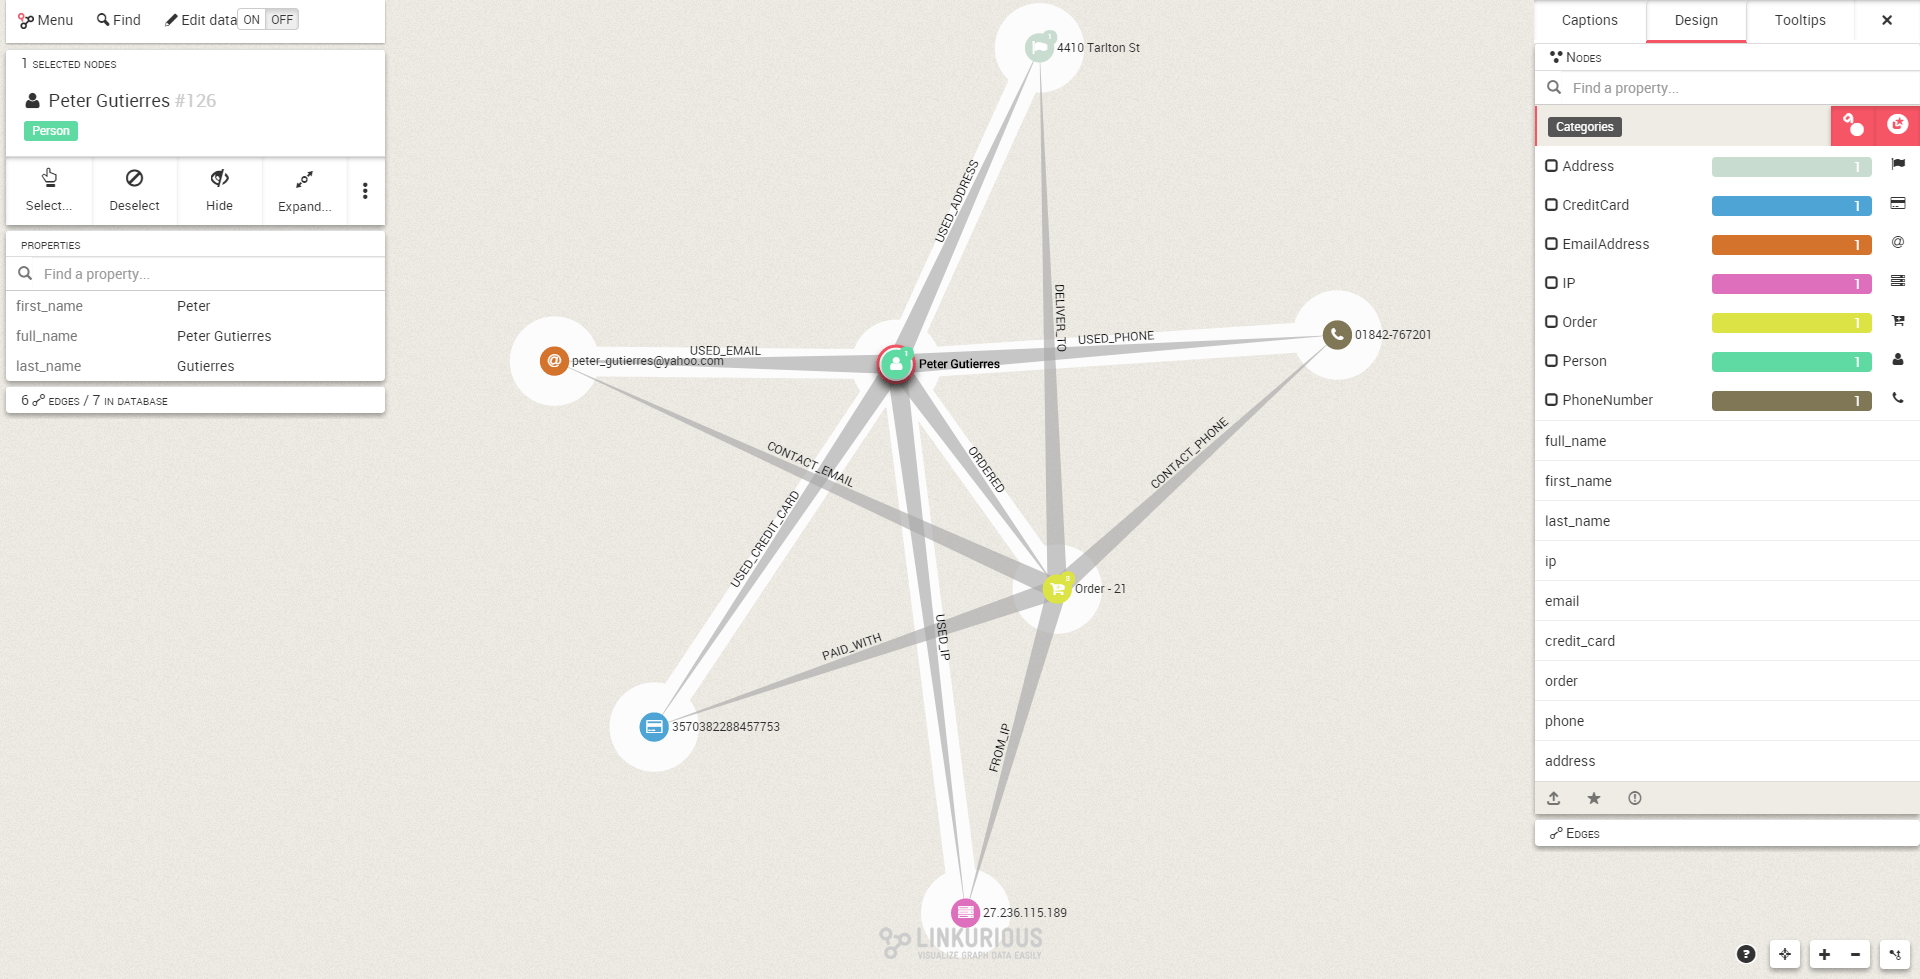
Now that we have an idea of what not to look we can start thinking about patterns specifically associated with fraud. One such pattern is a personal piece of information (IP, email, credit card, address) associated with multiple persons.
Neo4j includes a graph query language called Cypher that allows us to detect such a pattern. Here is how to do it:
//———————–
//Detect fraud pattern
//———————–
MATCH (order:Order)<-[:ORDERED]-(person:Person)
MATCH (order)-[]-(fact)
WITH fact, collect(order) as orders, collect(distinct person) as people
WHERE size(orders) > 1 and size(people) > 1
RETURN fact, orders, people
LIMIT 20
What this query does is search for shared personal pieces of information. It returns all groups of at least two persons and two orders connected by a common personal information.
To verify the accuracy of our query, fine-tune it or evaluate how to act on the alerts it returns, we will use graph visualization.
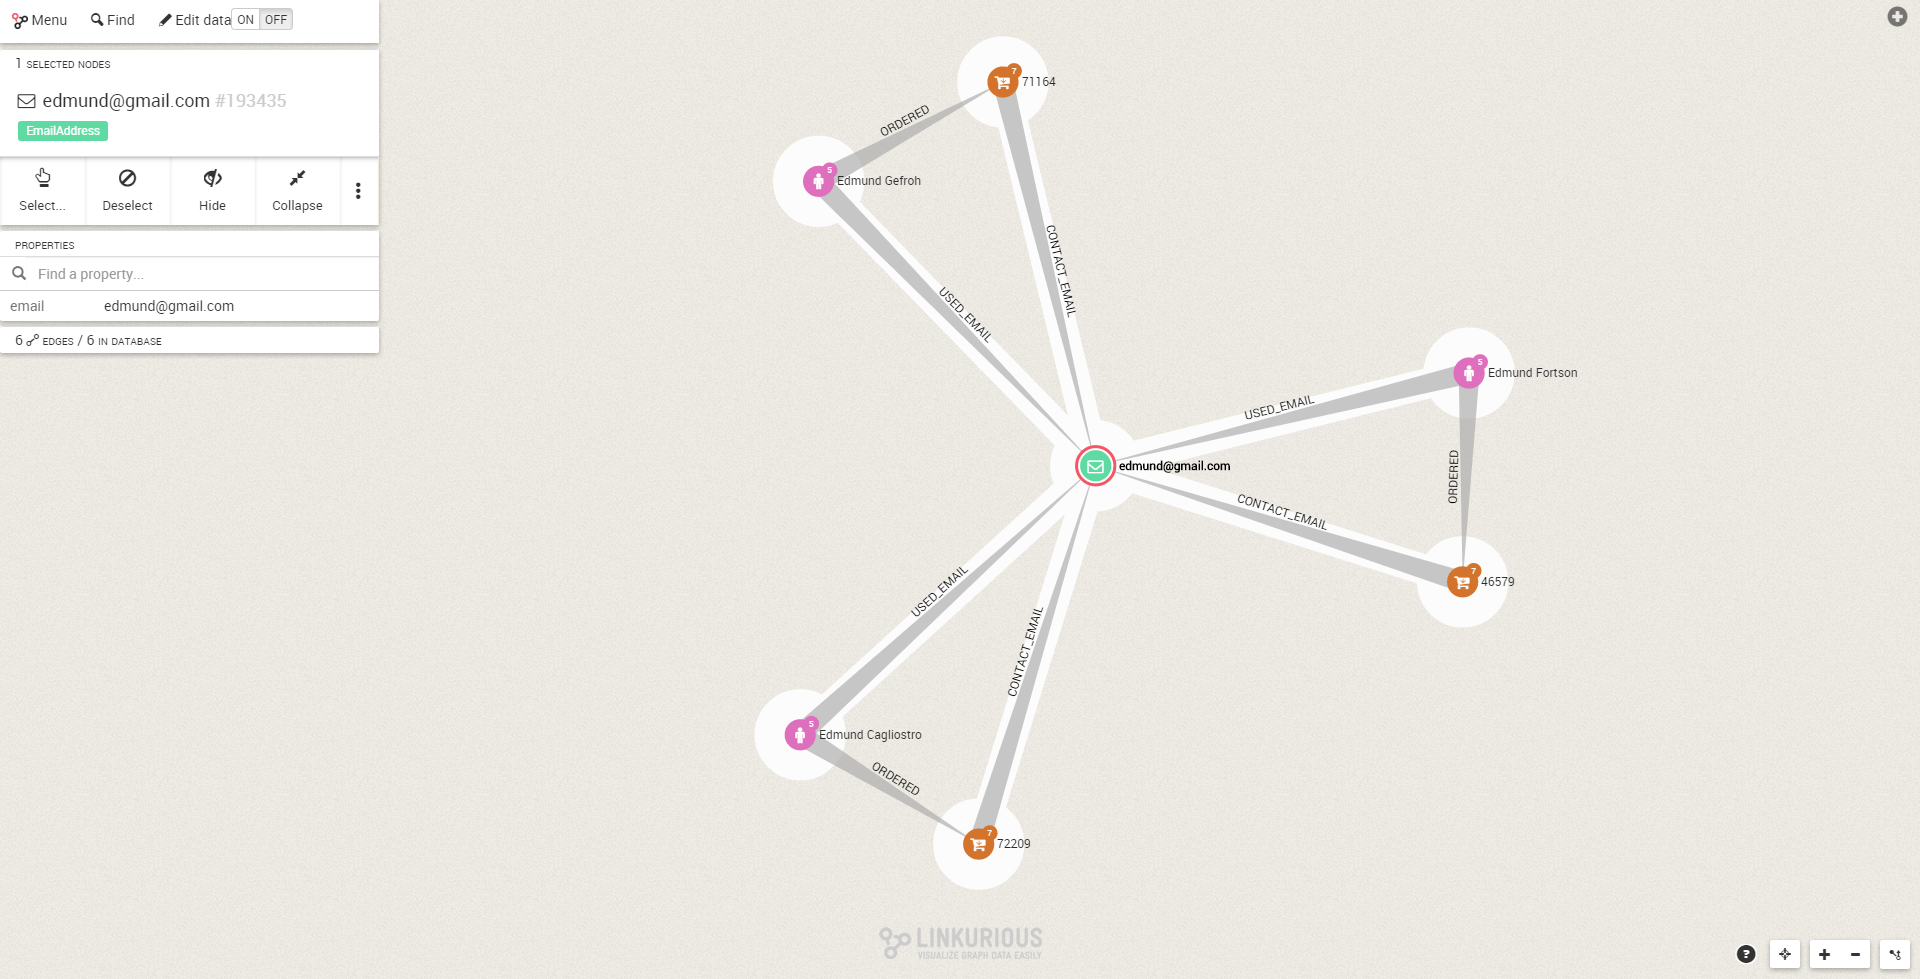
Here we can see that 3 persons are sharing the same email. Are we looking at a potential fraud? If we expand the graph, we can see that 3 persons have distinct addresses, IPs, phones and credit cards.
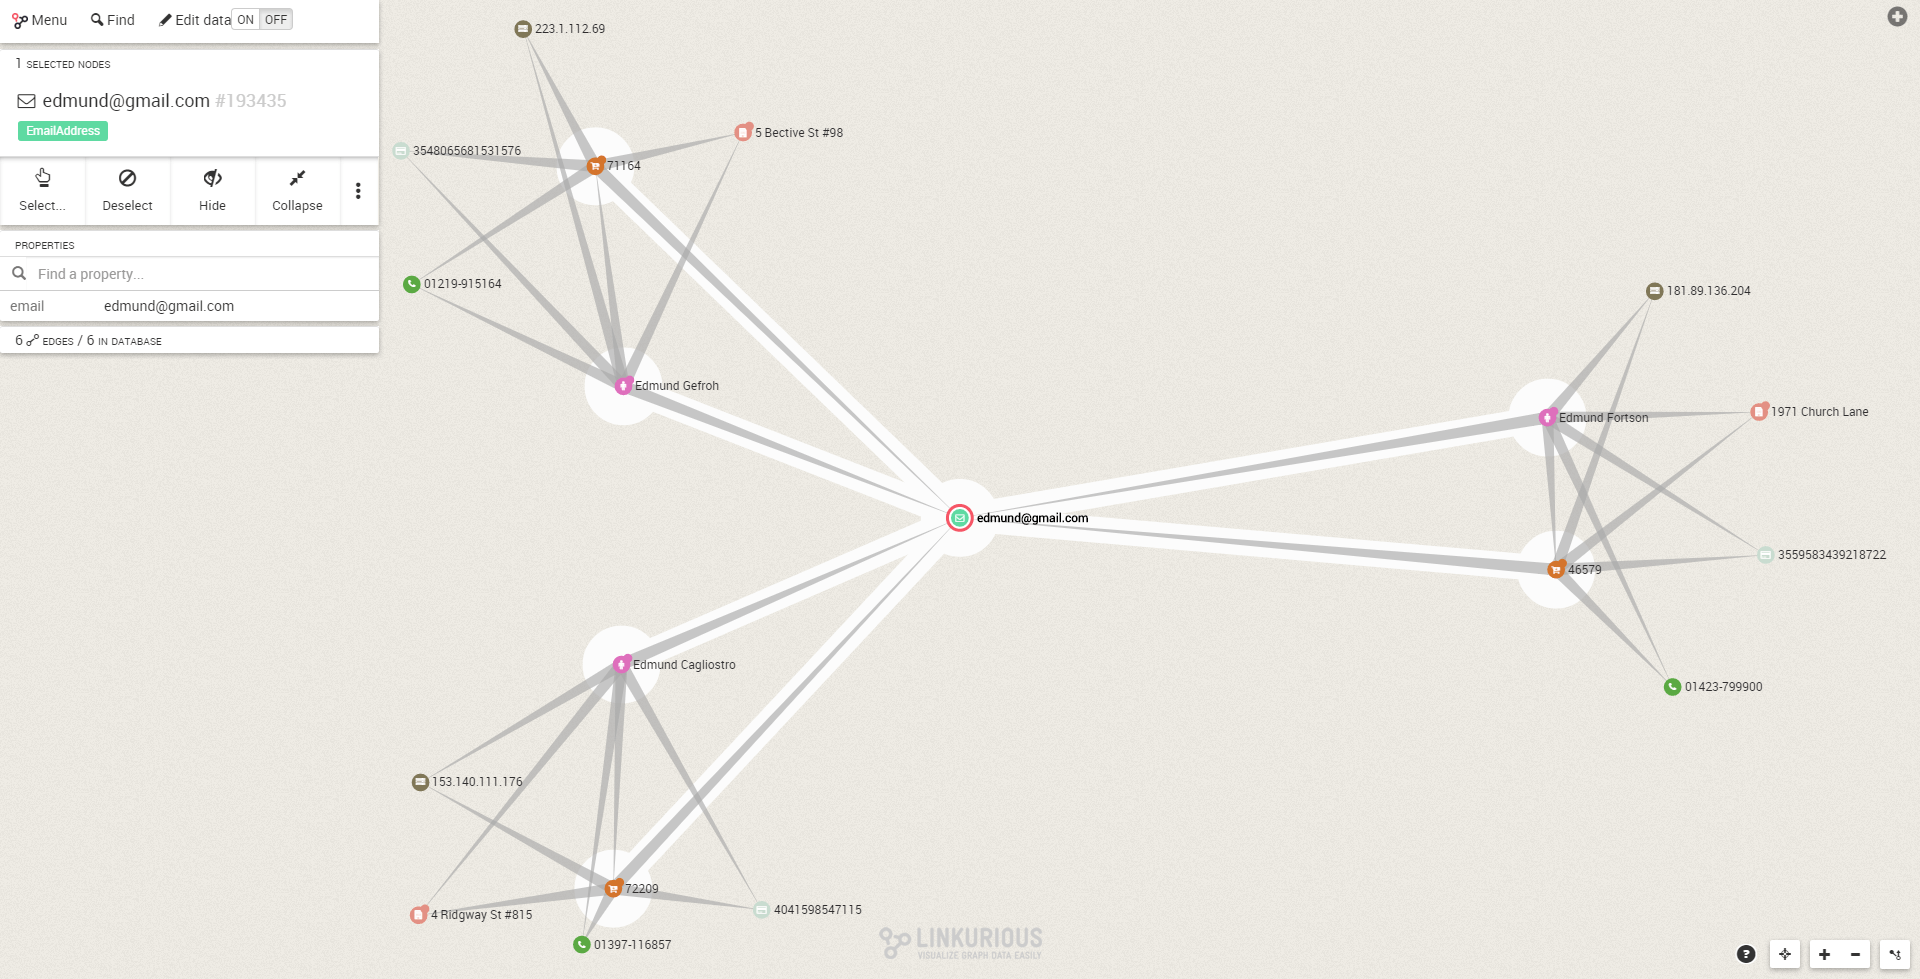
In isolation, each of this person looks normal. Edmund Cagliostro for example seems like a legitimate customer.
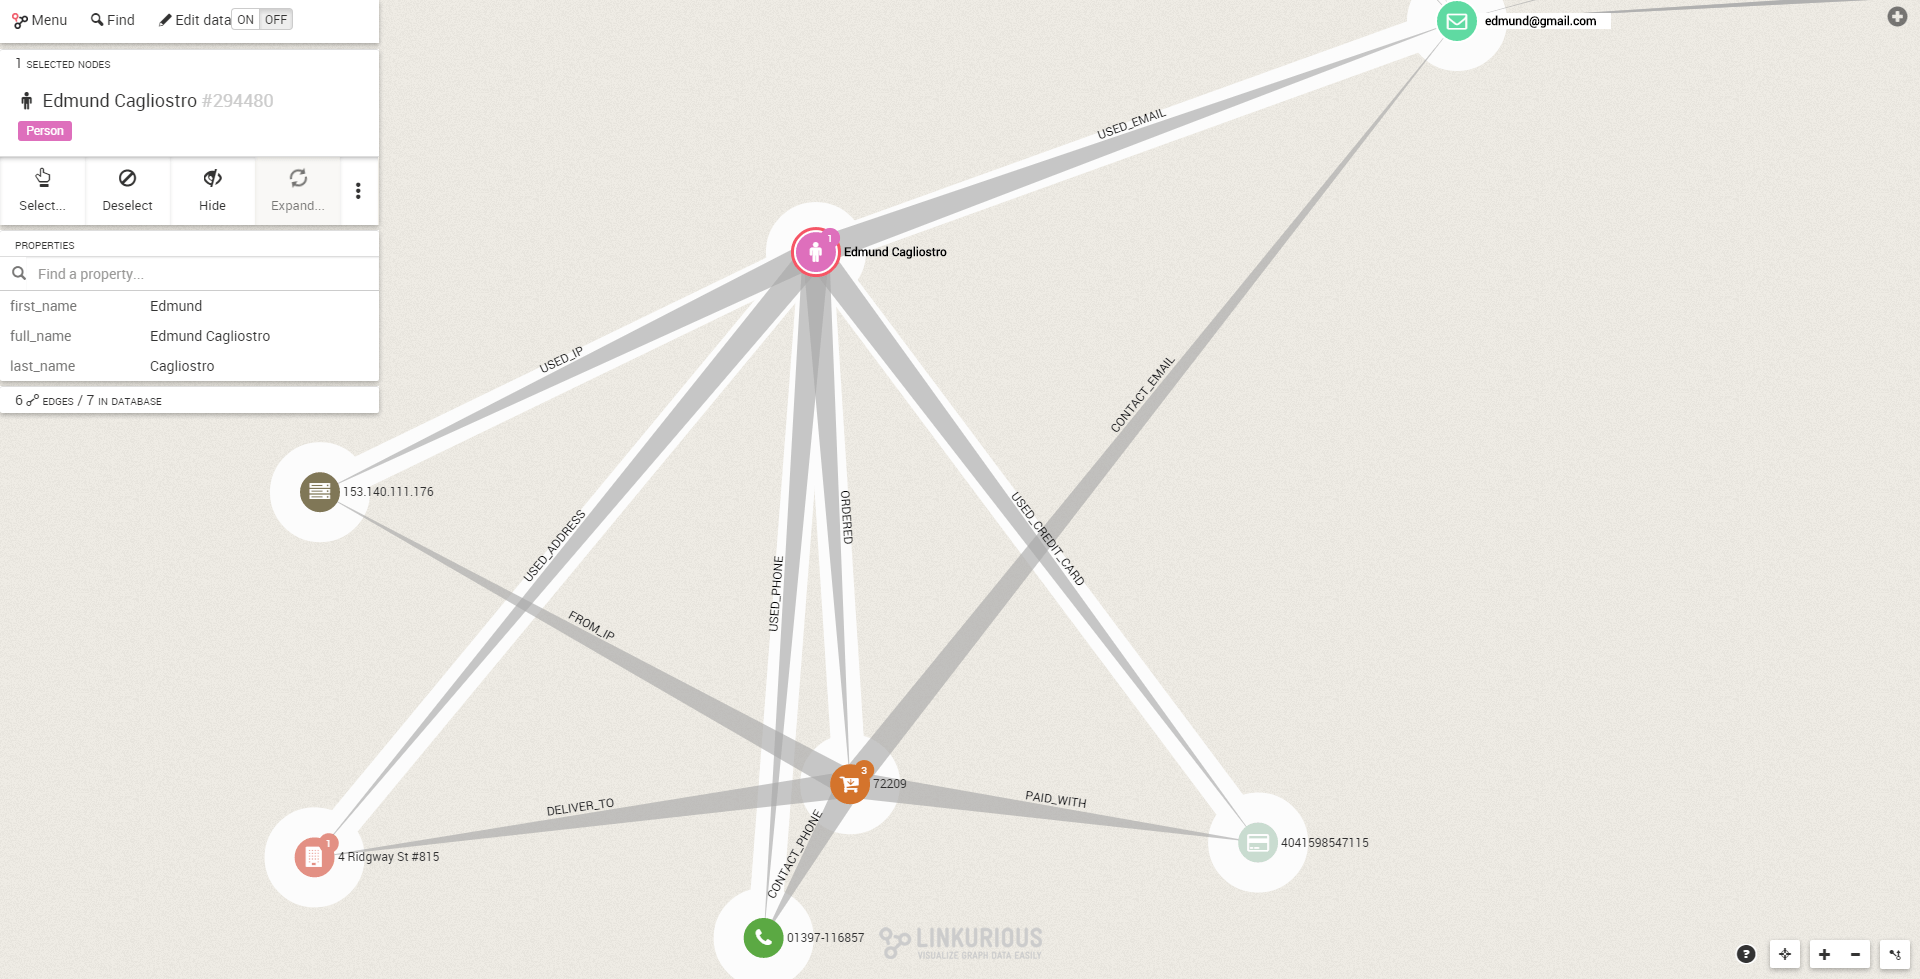
The fact that these seemingly distinct accounts share a common address is suspicious. It justifies to further investigate Edmund Cagliostro and its connections.
Our query also reveals an IP address shared by multiple persons.
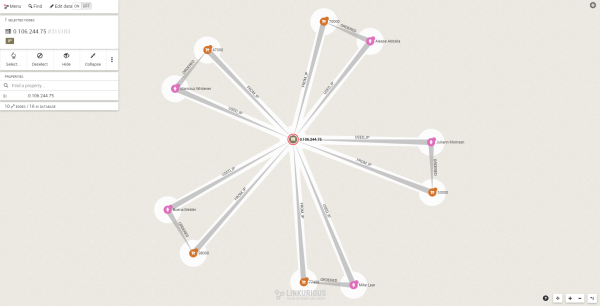
We can see that IP address 0.106.244.75 is shared by 5 people. Once again this is suspicious and should be investigated.
Graph visualization can help us inspect potential fraud cases and quickly evaluate them.
Now that we have found a couple of suspicious fraud cases, it’s time to dig deeper. We want to assess the full impact of an individual fraud to take appropriate actions.
Let’s say we noticed in our dummy dataset that a “Leisa Gugliotta” is involved in a fraud. Not only do we want to block any transactions from her but we also need to identify her potential accomplices. In order to do that, we need to see who else is using the personal information used by Leisa Gugliotta.
Here is how to do that via Cypher:
//———————–
//Who are Leisa’s accomplices?
//———————–
MATCH (suspect:Person {full_name:”Leisa Gugliotta”})
MATCH (fact)<-[:USED_EMAIL|:USED_PHONE|:USED_IP|:USED_CREDIT_CARD|:USED_ADDRESS]-(suspect)
MATCH (fact)<-[:USED_EMAIL|:USED_PHONE|:USED_IP|:USED_CREDIT_CARD|:USED_ADDRESS]-(other)
WHERE suspect <> other
RETURN suspect,other,collect(distinct fact) as facts
LIMIT 20
We can run the same analysis via Linkurious. The result is the following graph:
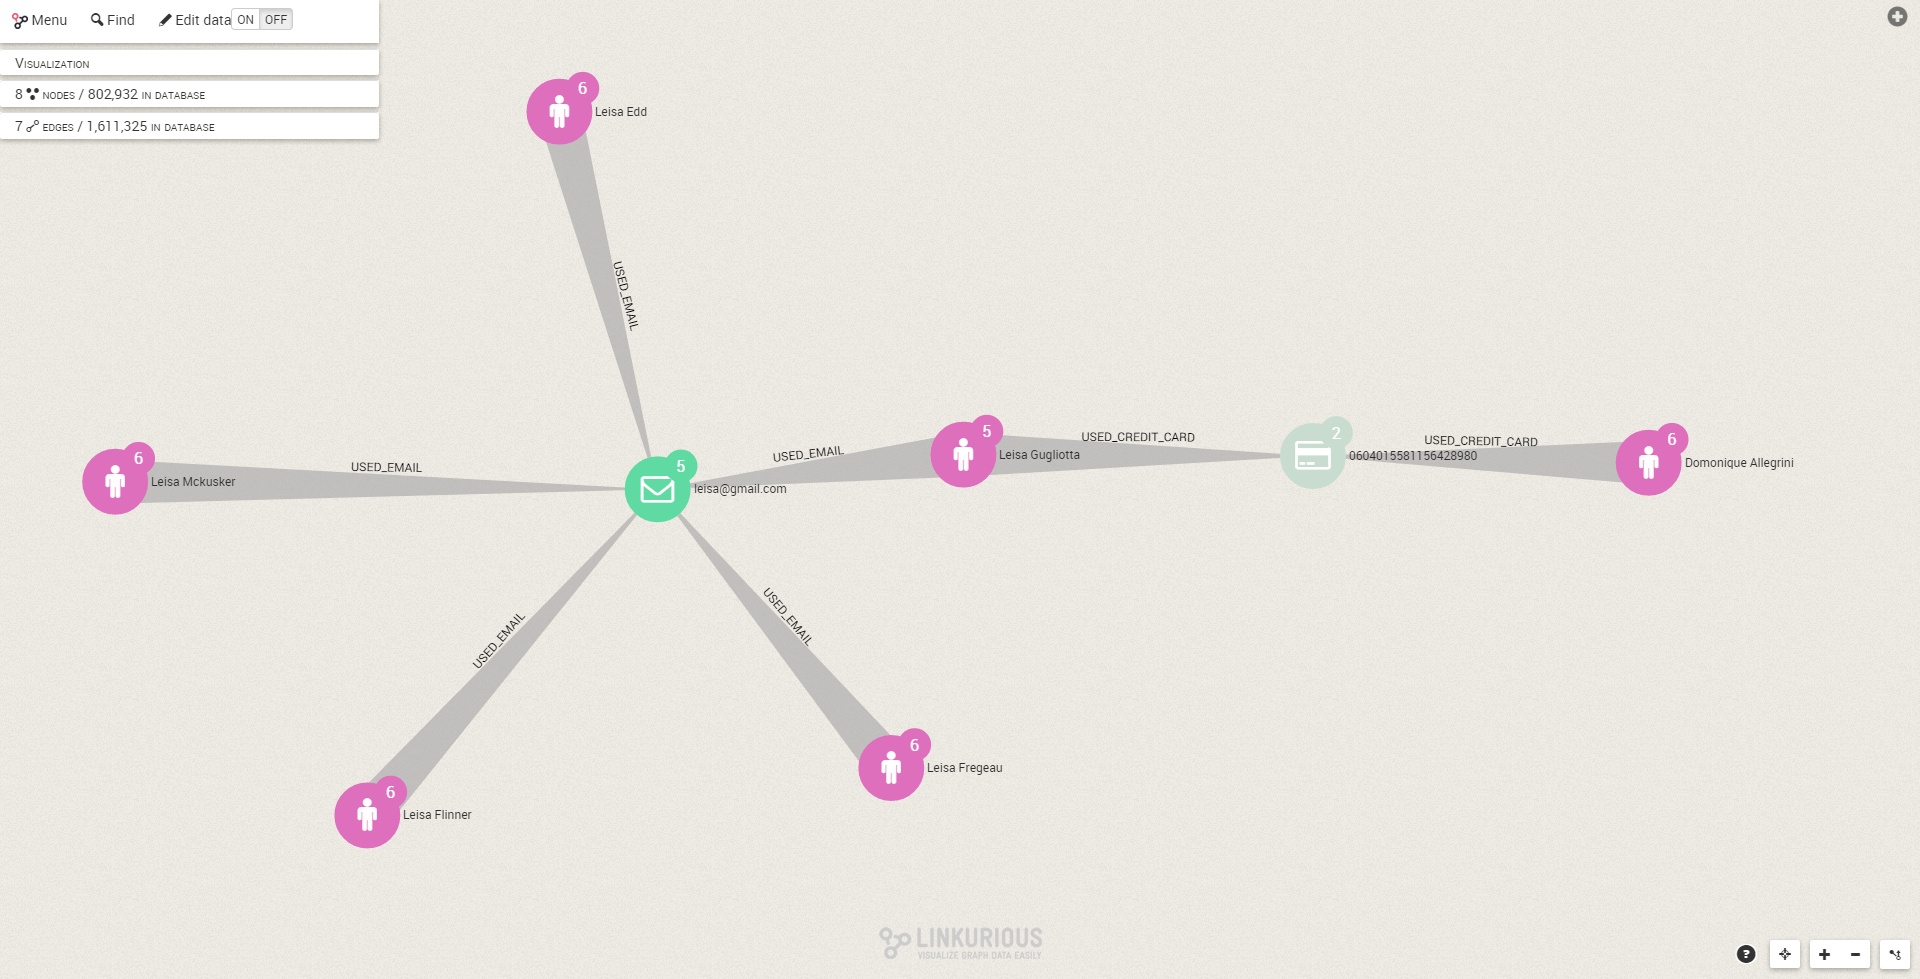
This picture makes it easy to view that our retail operation has been targeted by a fraud ring. Leisa Gugliotta shares a credit card with one other person and a email address with 4 people. These fraudsters can all be identified by the connections between them. Now we can freeze their accounts and add their information to our blacklist.
Third party fraud means that personal pieces of information are reused to create fake identifies (know as synthetic identities). Graph analysis makes it possible to spot that pattern and prevent fraud. Through graph visualization, we can quickly evaluate potential fraud cases and make informed decisions. See a demo.
A spotlight on graph technology directly in your inbox.

