Identifying ultimate beneficial owners: combining ownership data with graph technology
As organizations work to comply with regulations for identifying ultimate beneficial owners (UBOs), traditional manual methods of searching through ownership data have become insufficient. With large volumes of data - often a combination of internal and external sources - evolving compliance standards, and the need to stay on top of rapidly changing ownership structures and complex relationships that span jurisdictional borders, organizations are in need of new approaches.
One such approach is combining ownership data with graph technology to uncover a more complete picture of an entity's chain of control. In this article, we’ll explore the benefits and challenges of incorporating internal and external data like the Open Ownership Register to track down UBOs. We’ll also look at how graph visualization and analytics can help accelerate the identification of ultimate beneficial owners.
As financial institutions strive to prevent financial crime, gathering and analyzing data on company ownership has become an essential component of assessing risk and staying compliant. An ultimate beneficial owner, or UBO, is the person who has the final ownership over a company, trust, or other type of entity. Identifying the ultimate beneficial owners of a company can provide valuable insights into its operations and help pinpoint potential red flags. This type of analysis enables financial institutions to take a proactive approach in preventing fraud, money laundering, and other financial crimes.
Effectively, opaque corporate structures can be used for illegitimate purposes, concealing illegal activity. A bad actor might set up a new business to use as a front to bypass sanctions imposed on another corporation they are involved with. Shell companies and other shady corporate structures can also be involved in crimes like fraud, tax evasion, and corruption.
Using internal data, it’s easy to see what companies a client is connected to via directorship or as a shareholder. But using internal data alone, it can quickly get complicated to track down indirect connections, and these are frequently the kinds of connections that will alert you to potentially shady activity.
Internal databases often only give you a partial picture of your clients. By integrating external databases like national ownership registries or sanctions lists, you’ll gain valuable context around the beneficial ownership structure surrounding a company, leaving you better equipped to spot risks that you might otherwise miss. It makes sense: more data means more information with which to perform ownership analysis.
In practice, though, integrating external and internal data sources can also introduce some challenges. Data from various sources may remain siloed, which can limit or slow down your ability to analyze the full network around your entities of interest. Entity resolution challenges can also arise when attempting to match internal and external data. When you’re not sure if person A from data source X and person B from data source Y are the same person, your investigations can take more time than necessary and result in less accurate conclusions.
These challenges create a gap between having access to relevant external ownership data and actually being able to use it effectively.
Part of the puzzle is having more standardized data. Open Ownership is driving a global shift towards transparency over who owns and controls companies. They support over 40 countries to make high-quality beneficial ownership data shareable, and they have developed the Beneficial Ownership Data Standard. This open standard provides guidance on how to collect, share, and use high-quality data on beneficial ownership, as well as associated tooling. Many countries now use this data standard, with Nigeria being the latest to adopt it.
The Open Ownership Register is a demonstration of the value of public, open beneficial ownership data. The database, which compiles over 23 million beneficial ownership records, maps ownership data from four national beneficial ownership registers to their data standard and combines it into a single dataset.
“We know that people have a huge challenge using beneficial ownership data,” says Stephen Abbott Pugh, Head of Technology at Open Ownership. “A survey carried out in 2021 by the Financial Action Task Force (FATF) found beneficial ownership data to be the most problematic of all fields causing friction around cross-border payments.” Open Ownership’s data can help investigators see pertinent information they may not have been able to see with internal data alone: if a given entity is involved with multiple companies, for example, or if a company has directors from high-risk jurisdictions.
Graph technology can help solve many of the major challenges that arise when combining internal and external data, in turn helping to more efficiently and accurately identify beneficial owners. Multiple datasets can be combined within the same graph database, effectively de-siloing data coming from different sources.
Graph technology can also drive a lot of value in terms of entity resolution. Graph analytics provides algorithms like weakly connected components and cosine similarity that are suited for the detection of potential duplicates. For more complex use cases, tools like Senzing can easily be integrated with your graph tools to perform advanced entity resolution.
Graph also allows you to see the full network of connections around entities of interest to quickly track down chains of ownership and identify suspicious activity. And a graph visualization and analytics tool like Linkurious Enterprise has features that facilitate and speed up investigations. Let’s take a closer look at how graph technology can improve your UBO identification processes.
In a demo during our recent webinar with Open Ownership, we explored exactly how software like Linkurious Enterprise works for identifying UBOs and investigating the context around beneficial owners using data from the Open Ownership Register. In our example, we take on the role of a bank looking to do business with a new company. An important step will be to assess the risk around that company.
In a couple of clicks, you can expand all relationships to that business. A graph visualization of the full network surrounding that entity enables you to quickly grasp the full picture: who is associated with that business, who has ownership stakes, and who is the ultimate beneficial owner.
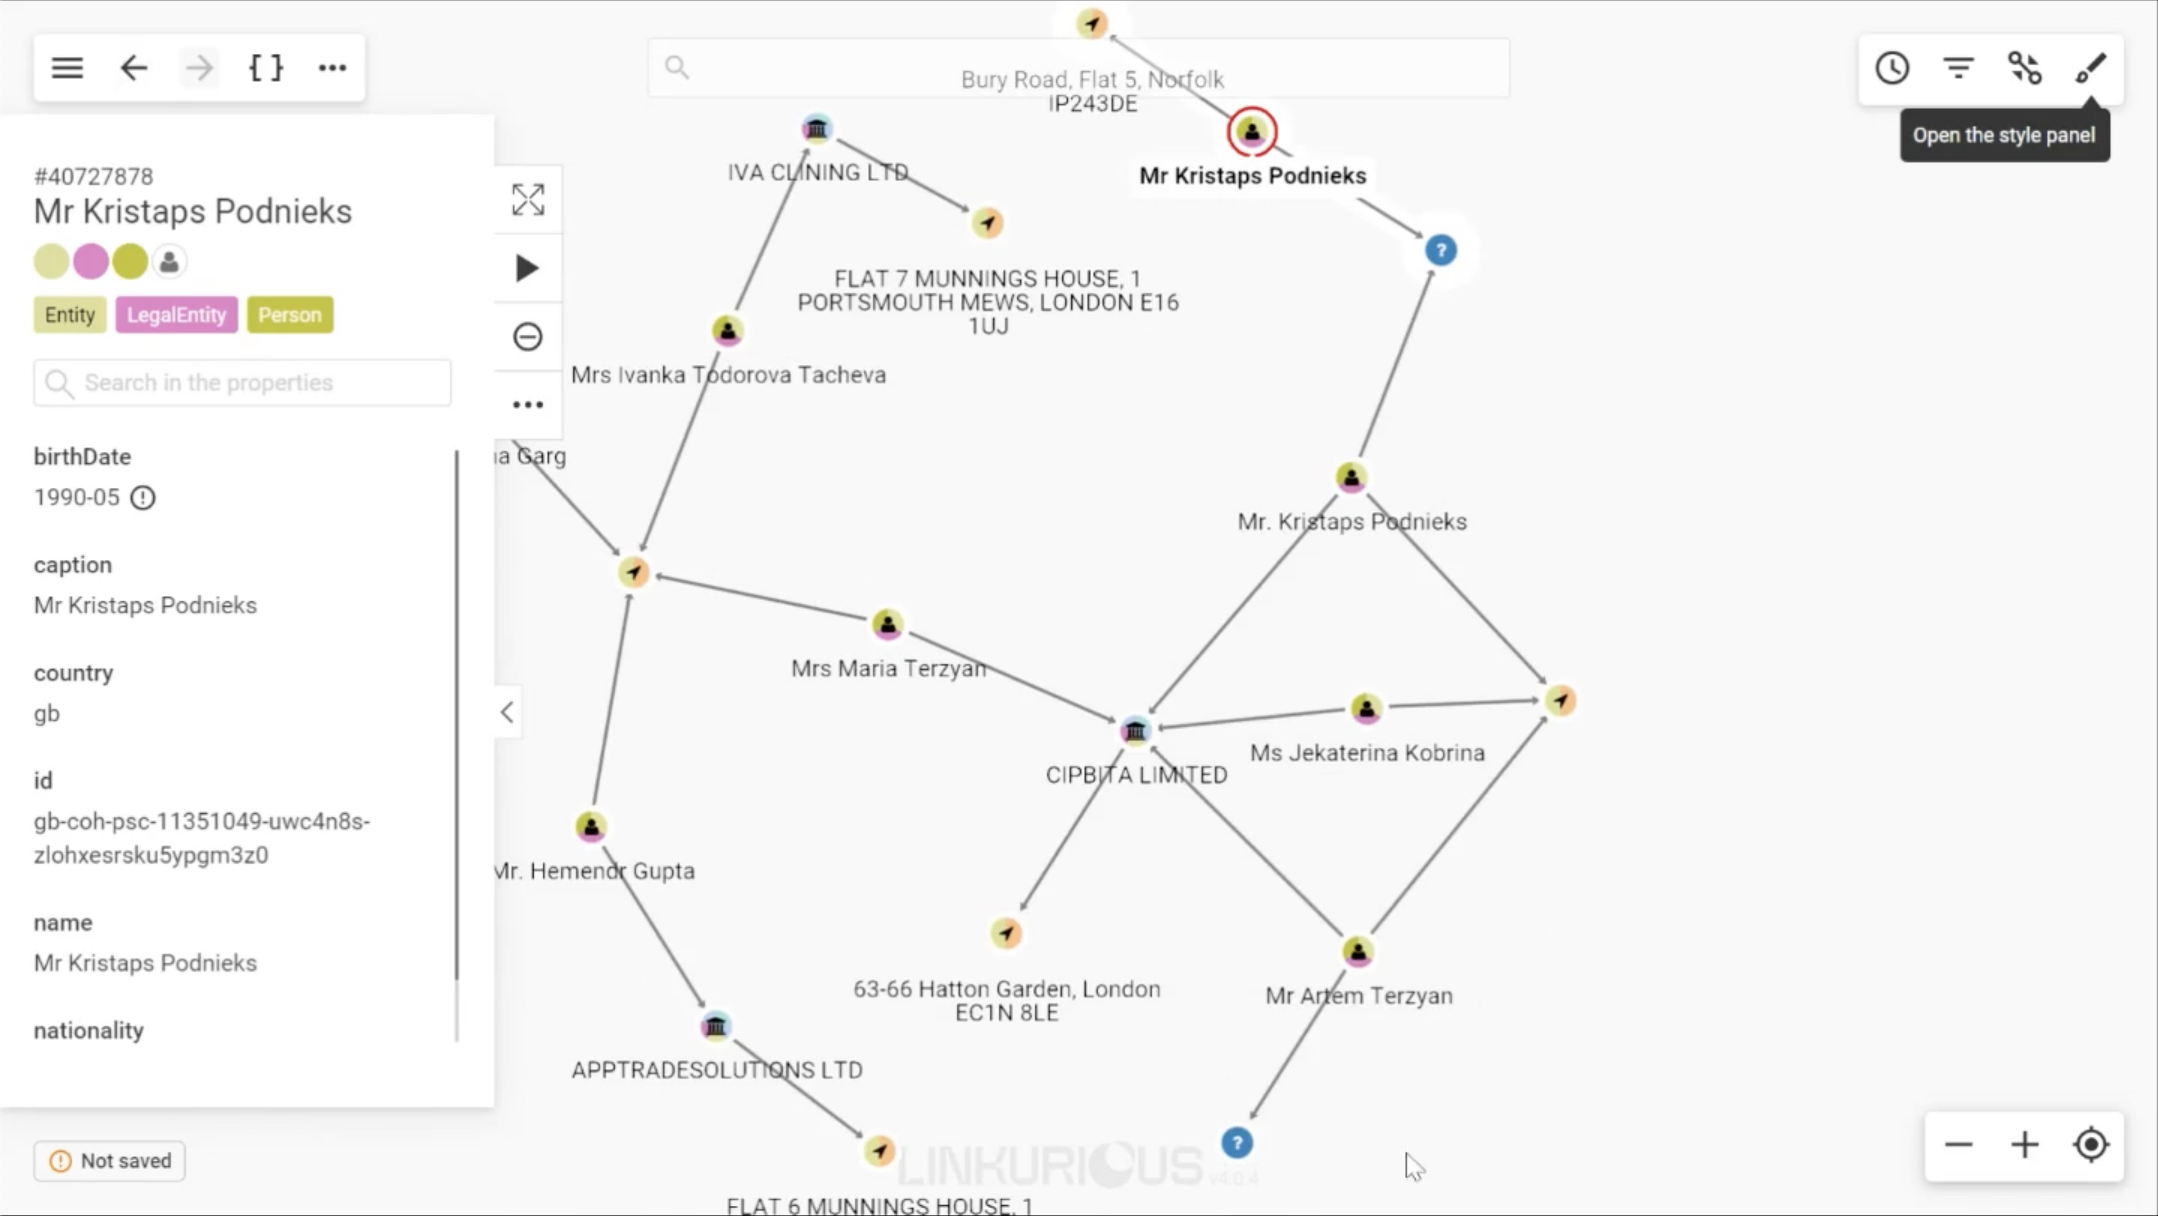
Linkurious Enterprise has several specific features that facilitate beneficial ownership identification.
Query templates automate investigation workflows by turning repetitive actions into a button or form. Several query templates available in Linkurious Enterprise can help you save a lot of time in tracking down UBOs. The “Find UBO” query template will automatically point you to the ultimate beneficial owner of any company in your graph visualization. A “Find shortest path” query will indicate the most direct path between two entities. And the “Find indirect connections” query will show you everyone and everything your entity of interest is connected to indirectly.
Custom actions take information from a node or a relationship and use it to generate a dynamic URL based on a template that you provide. They make it possible to seamlessly enrich the insights provided by Linkurious Enterprise with external tools and resources. When exploring beneficial ownership, you can set up a custom action to look up an entity on Open Ownership, for example, or on Google search to determine if there is any adverse media associated with that entity.
To be proactive in your risk management around beneficial owners, you can set up alerts in Linkurious Enterprise. For better efficiency, you can combine multiple models into a single alert. For example, you can set up a single alert that will look for three different patterns at once, such as: business entities with a long ownership chain, directors associated with multiple other companies, and business entities with foreign directors. These scenarios don’t mean there is definitely risky behavior going on, but they are patterns that merit further investigation.
Any time one of these patterns appears in your data, you’ll receive an alert. Linkurious Enterprise is able to deduplicate these models, meaning you’ll only receive one single alert if one company fits two or three of these patterns.
UBO identification is a crucial risk management and compliance practice for financial institutions. Adopting graph visualization and analytics can help meet the challenges of sifting through large quantities of internal and external data to more accurately and efficiently identify ultimate beneficial owners. Next-generation technology solutions like Linkurious Enterprise can help organizations stay ahead of regulatory requirements, mitigate risks, and strengthen due diligence processes. Start finding UBOs with graph today.

A spotlight on graph technology directly in your inbox.