This year the annual GraphLab Conference will bring together in San Francisco more than 900 data scientists, software engineers and big data analytics thinkers. They all share a real enthusiasm for the potential of graphs. The word used to be associated with tech giants like Google or Facebook who touted their Knowledge Graph and Social Graph. Now a handful of companies are democratizing graphs and enabling a new wave of innovation.
Graph theory is the branch of mathematics and computer science involved with the study of sets of objects linked by relationships. Before everyone started seeing networks everywhere, graph theory was relatively obscure. Now it may be the key to answer some today’s most pressing data challenges :
- increasing amount of data ;
- mashing up of multiple data sources ;
- constantly evolving data structures ;
All these tendencies make today’s data hard to store and analyse. The traditional SQL-like databases were centered around tables. Although still very useful, in most domains tables cannot capture the messy real-world data. Graphs on the contrary are a very flexible way to represent reality. It simply assumes that there are objects or nodes that are linked by relationships. This free-form approach to data is more fitting for messy datasets.
The real value of graphs is that they allow to extract insights that are hard to come by with other approaches. Google built its business by using graph theory to assess the respective authority of different web pages. The PageRank algorithm was the basis of Google’s search engine and allowed the Mountain View company to offer better results than the competition.
Linkedin has built a flourishing data-centered business around what it calls the “economic graph”. The professional social network is a giant graph. Linkedin monetizes it by allowing recruiters to tap into it to find recruits. Today, it is Facebook, an other social network, that leads the way in terms of what can be achieved with graphs. Its Graph Search product can be used by Facebook’s 1bn users. It is a new way to find information : a Facebook user can look through his own network to find answers to his questions. Looking for a sushi place in Paris? You can ask Facebook to tell you who among your friends has been to Japan, lives in Paris and can recommend a good sushi place. Where Google’s search experience bring you results more or less correlated to your query, Facebook gives you an actual answer. Finding that answer is actually equivalent to exploring a graph formed by the people, places and preferences Facebook collects.

Graphs make it possible to extract new insights from complex and large datasets. Until recently it was reserved to the Silicon Valley biggest players but now this is changing.
In 2014, for all the talk about big data and disruption, the leading database vendor is still a company called Oracle. With US$ 37.18 billion in revenues in 2013, Oracle whose key products are relational databases demonstrates that a lot of companies are still playing catch up with innovation. In contrast, it is estimated that in 2014 the total market for big data NoSQL databases should be around US$ 730 million.
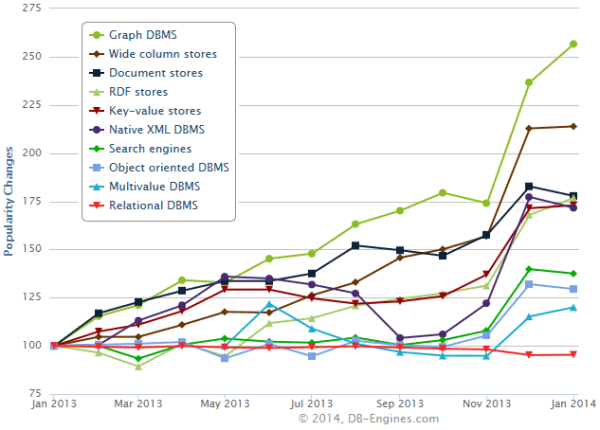
It is hard to estimate the size of the graph technology market but it is certainly only a portion of the total NoSQL market. Just like other big data technologies, graph technologies are used by a limited number of companies…but a lot of people are excited by it. For example last year graph databases were the fastest growing database technology.
Are we looking at a new technology fad? Maybe but beyond the momentum there is a profound trend toward extracting insights from complex and large datasets. As long as this need will remain, graphs will remain relevant : it is time to get familiar with some of the leading graph technologies.
Graph databases play a key role in the graph ecosystem. When the only SQL-like databases were available, interest in graphs was mostly academic. Working with data stored in relational databases made it hard to apply the graph insights in the real world. Performance issues and the complexity of handling relationships dissuaded developers to look at their data through the graph prism.
Neo4j, the graph database developed by Neo Technology made it easier to work with graphs. Since the launch of the V1 in 2010, Neo4j garnered a lot of interest. Its open-source edition makes it very easy for developers to start experimenting with graph databases. Today, Neo Technology is the leading graph database with a long list of customer references and many users. It remains focused on usability with recent releases bringing changes in the ETL process and data visualization.
In addition to Neo4j, there are a few other graph databases projects worth noting. Sparsity Technologies and Objectivity, editors of Sparksee (formerly DEX) and InfiniteGraph have been around for a while. Their fully commercial licenses means they are less visible but they are well established. InfiniteGraph is used by customers like Siemens or Nortel. Sparksee is the only graph database compatible with iOS and Android.
Titan, an other open-source project has been gaining a lot of attention lately. Though still in early stage, Titan is an ambitious project. It is a distributed graph database built to store and query graphs in the hundreds of billions of vertices and edges.
Other solutions include HypergraphDB (a database based on directed hypergraphs) or Cayley (a new open-source graph database).
Instead of using dedicated graph databases, some companies rely on other technologies to store their larger graphs : Accumulo, HBase or Cassandra.
Using graph algorithms to make sense of data is not a new trend. As early as 2010, paper described Pregel, the graph processing system built at Google. Since then a few other solutions have emerged to provide developers and data scientists with scalable solutions to analyse graphs.
Giraph, the Apache project, is an iterative graph processing system built for high scalability. It is currently used at Facebook to power its famous Graph Search. At Facebook, Giraph can process a graph with trillions of connections between people, places, likes and interests in minutes. It is compatible with Hadoop.
An other popular solution for graph computing is Graphx. It is integrated to Apache Spark, an open-source data analytics cluster computing framework. GraphX has a built in library of algorithms and include ETL functionalities. It doesn’t offer the same performances as Giraph but is easier to use.
People interested in Machine Learning can turn to GraphLab to analyse their graph data. GraphLab was started as an open-source project by Prof. Carlos Guestrin of Carnegie Mellon University in 2009. Recently it has evolved in a data science toolbox but remains very useful for graph analytics.
The team behind the Titan graph database has also released Faunus. Faunus is a Hadoop-based graph analytics engine for analyzing graphs represented across a multi-machine compute cluster. It is compatible with HBase, Cassandra or Hadoop.
Intel has launched recently a project with a different focus. GraphBuilder aims to solve a common issue : most data is not structured as a graph. GraphBuilder serves to format and prepare data for graph analysis. It is based on Hadoop and speeds up the un-glamorous “data wrangling” part of graph projects.
The last years have seen the rise of an impressive collection of graph computation frameworks backed by major players like Facebook or Google. These technologies are empowering a new generation of developers with graph algorithms. But what about business users? A few data visualisation solutions aim to make it easier for them to explore and visualize graphs.
Developers looking for a graph visualization library now have many options to choose from. D3.js is widely used in the infoviz community and can also display graphs. Sigma.js, VivaGraph.js or Alchemy.js are open-source libraries designed especially for graph visualization. They can provide better interactivity, better performances or be easier to use. Cambridge Intelligence offers Keylines, a more advanced library that comes with a commercial license. Tom Sawyer Software sells a collection of software development kits for graph visualization and analysis. Its products are used by established companies like NASA and Oracle. It is compatible with ActiveX, C++, Java, and .NET.
These different libraries are used to bring a data visualization component in software project. It makes it easier for business users and data scientists alike to interact and understand graph data. Graph visualization is bringing “graph thinking” to the masses.
Gephi has played a key role in this process. It is an open-source graph visualization solution that packs a powerful set of SNA algorithms and visualization options. Used by a wide community of scientists and data scientists, it had been dubbed the “Photoshop for graphs”. Another graph visualization solution is Cytoscape. Mostly used by biologists at first, it has progressively evolved in a more general platform for complex network analysis and visualization. Gephi and Cytoscape are desktop-based.
Graph visualization is going beyond the world of scientists. At Linkurious, we are building a commercial solution that aims to democratize graph visualization. The interface of our application is designed for the interactive exploration of large graphs and comes directly with features common in traditional business intelligence applications (security, user management, etc).
Lastly Lab41, the company tasked with helping the US intelligence community tackle big data has built Dendrite. Dendrite is an open-source solution that mashes up other graph technologies (Titan, GraphLab) in one solution to analyze and manipulate large graphs.
In addition to the aforementioned projects, it is worth noting that a few startups like Shutl or Elementum are building full stack products in very graph oriented industries.
If you are interested in graph technologies, I recommend you follow :
- Ayasdi is based on 10 years of research at DARPA, Stanford and NSF. It uses topological data analysis to reveal insights hidden in extremely large datasets. Ayasdi claims to “answer the questions you never even thought to ask” by visualizing the correlations in large datasets.
- Emicien works on automatically revealing connections in data. Its technology uses graph model algorithms to identify relationships, defocus noise, and rank findings to direct users to relevant results. The end result is interpreted through a graph visualization.
- Palantir, the mysterious San Francisco startup working with US agencies seems to rely heavily on graphs. Palantir Gotham, the flagship product of Palantir, turns data “into meaningfully defined objects and relationships: people, places, things, events, and the connections between them”.
I hope this brief introduction to the emerging graph technologies landscape will inspire you to start leveraging the graphs in your data!
A spotlight on graph technology directly in your inbox.