In this series of blog posts, we showcase how the Linkurious’ SDK helps developers build enterprise-grade graph applications faster.
Part 1: Introduction to the SDK and its security features
Part 2: Querying and displaying graph data
Part 3 (this article): Advanced interaction and styling with the Ogma graph visualization library
In the previous posts, we detailed the SDK’s features and its main components. We also introduced some of the high-level services provided by the Linkurious Server. In this post, we are going to cover the benefits of graph visualization, as well as the advantages of Ogma, our JavaScript graph visualization library. In the last part, we showcase some of its features and give examples of what you can do with it.
From fraud detection to enterprise architecture management, graph technology has proven to offer a significant advantage to find insights from the connections in big data collections. In addition to graph data storages and analytical frameworks, interactive visualization tools are an essential layer to leverage the value of connected data. Below are some of the benefits of graph visualization:
- Increased insights discovery, thanks to the visualization of patterns and correlations. Graph visualization highlights relationships between heterogeneous data which allow achieving a new or deeper understanding of a problem.
- Faster comprehension of information and therefore faster reaction. The human brain processes visual information faster than the written one. Visually displaying data ensures a faster comprehension which reduces the time-to-action.
- Higher chance of discovering hidden insight, thanks to interaction. Graph visualization tools offer the possibility to directly manipulate the data. It encourages the appropriation of the data, its questioning and in the end increase the possibility to discover actionable insights.
- Better assimilation of vast amounts of information. Visual representations offer a more intuitive way to understand the data. They are a great medium to share and report information with decision-makers.
- Greater accessibility to non-technical users. Specific programming skills are not required to interact with graph visualizations. More users can reach the insights they need, increasing the value creation.
For those reasons, many industries use graph visualization to solve today’s most complex connected data challenges. For instance, fraud detection units can visualize clients financial activities and connections to spot suspicious rings in a glimpse. IT operation managers can leverage visual representations of their organization’s infrastructure to understand dependencies between existing assets. Scientists can map and compare drug molecular compositions to highlight relationships between drugs and side effects. And the list goes on.
There are a lot of tools available to visualize and analyze graph data. As the landscape keeps growing, you will have a lot of possibilities to choose from. But some tools might be a better fit depending on the type and volume of data you have and on your application use-cases and requirements. As mentioned in our first article, Linkurious’ graph SDK includes Ogma, a JavaScript graph visualization library. It offers several advantages that we detail in the following part of this post.
We developed Ogma with the goal to empower developers building web-based graph visualization applications. It’s a perfect fit for companies wanting to quickly develop a robust and rich application for large graphs. The advantages of Ogma are the following:
- It’s easy to use
- It’s fast to develop with
- It supports large graph interactions
- It provides tools to implement a large panel of features
As explained before, the Linkurious server deploys on top of your graph database and offers high-level services directly available in your web application. Using Linkurious REST Client library as the interface between Ogma and the Linkurious server makes fetching subgraphs and displaying query results straightforward. By itself, Ogma is agnostic to the data source so you can easily create a connector to your own files, server or database.
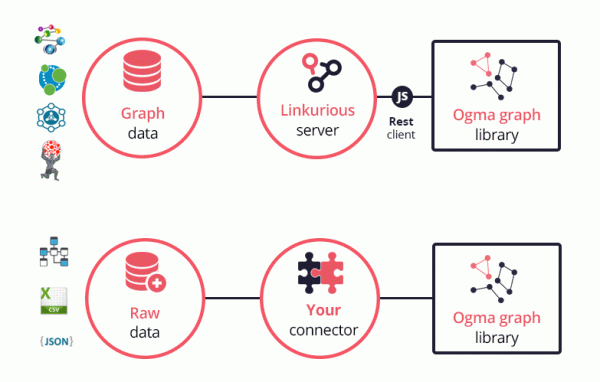
This JavaScript library does not rely on external dependencies. It comes with Typescript typings and is compatible with ES6 features (such as Promises) while ensuring backward compatibility with plain old JavaScript. Ogma also offers an easy to use and well-documented API to manipulate data, create styles and handle user interactions with the graph.
Today, it is also one of the most powerful web-based graph library. Visualization of large graphs is possible thanks to WebGL’s GPU rendering. When most libraries have issues rendering interactive visualizations that have more than a thousand nodes and edges, Ogma scales up to hundreds of thousand nodes and edges.
The library offers a wide set of features for data import, interaction, and visualization of large graphs within Web applications. From layout algorithms to import and export features or custom styling, Ogma supplies a rich panel of functionalities to create first-rate graph applications. In the next part, we give some examples of what you can achieve with Ogma.
The different modules and methods available in the Ogma API allow developers to create rich interactive applications. Below are some details and interactive examples of features that you can implement in your application to control the interaction and the styling of your data.
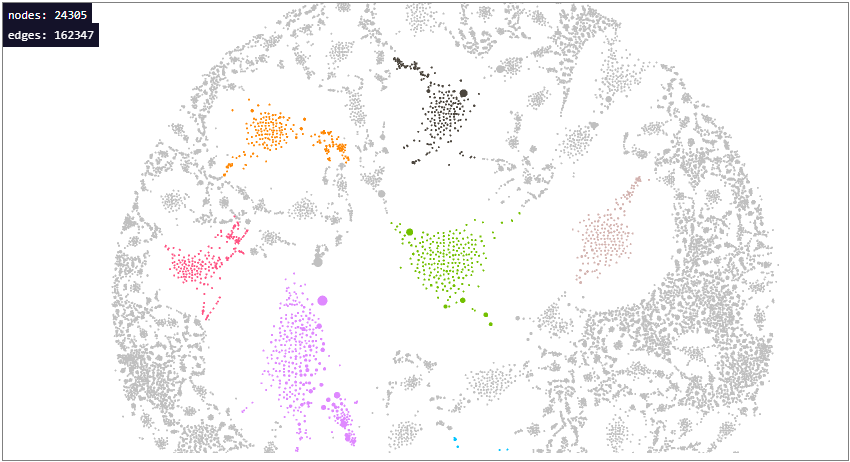
The different interaction modules let you control how to display the data for a fast understanding. Ogma provides several layout algorithms to help reveal structural patterns with parameters to optimize the readability of the visualization. You can choose from several layouts (Grid, Concentric, ForceLink, or Hierarchical) and switch from one to another depending on the size of the graph and which information you want to emphasize. For instance, the ForceLink layout is great to identify clusters because it locates nodes in such a way that connected nodes attract each other while disconnected nodes repulse each other.
In some cases, you need the ability to filter the data. Ogma proposes both a selection and filtering modules that allow focussing on specific nodes and edges. They provide methods to interact with nodes and edges depending on a predicate or on the user actions (a mouse selection for instance). This can become handy when you want to visualize and analyze subgraphs of data you have identified.
Developers can also customize the style of the visualization using the Ogma design module. It provides methods to change visual variables based on node or edge properties. For example, you can color nodes based on a category or size them based on a numeric property. This can be particularly helpful to highlight specific information (e.g. important amount or value, highly connected node, etc) or simply display a clearer graph representation.
Example of interaction, filtering and styling features set up with Ogma – Use mouse and scroll to navigate the graph.
There are many other features available with Ogma. From displaying to exporting the data, Ogma will offer methods to help you create interactive and custom-built graph visualization applications. You can refer to our documentation for the full list of features and more examples.
Ogma and the Linkurious SDK let you quickly build robust graph applications, adding new capabilities to your existing architecture. It allows you to leverage the power of graph visualization. The many advanced services available, both through the RESTful API and Ogma API, give you a unique and flexible toolkit to build tailored applications and get results quickly.
For more information about Ogma and the SDK, contact us!
A spotlight on graph technology directly in your inbox.